Tharp's Thoughts Weekly Newsletter (View On-Line)
-
Article Monthly Market Update by Van K. Tharp, Ph.D.
-
-
-
New! Our First Workshop Video for Systems
-

$700 Discount on Peak Performance 101
Expires Next Week, June 11th.
The Peak Performance 101 workshop has been the core of Van Tharp's instruction for 25 years.
Be sure to register soon to ensure a seat. This workshop often sells out and is over half full and the Peak 202 and 203 workshops only have a few seats left.
Click here for more information, combo discounts and to register.
Article

Monthly Market Update
Market Condition: Bull Quiet
by Van K. Tharp, Ph.D.
View On-line
I always say that people do not trade the markets; they trade their beliefs about the markets. In that same way, I'd like to point out that these updates reflect my beliefs. If my beliefs and your beliefs are not the same, you may not find them useful. I find the market update information useful for my trading, so I do the work each month and am happy to share that information with my readers.
However, if your beliefs are not similar to mine, then this information may not be useful to you. Thus, if you are inclined to do some sort of intellectual exercise to prove one of my beliefs wrong, simply remember that everyone can usually find lots of evidence to support their beliefs and refute others. Just simply know that I admit that these are my beliefs and that your beliefs might be different.
These monthly updates are in the first issue of Tharp's Thoughts each month. This allows us to get the closing month's data. These updates cover 1) the market type (first mentioned in the April 30, 2008 edition of Tharp's Thoughts), 2) the five week status on each of the major US stock market indices, 3) our four star inflation-deflation model plus John Williams' statistics, and 4) tracking the dollar. I will now report on the strongest and weakest areas of the overall market as a separate SQN™ Report. And that may come out twice a month if there are significant market charges.
Part I: Van Commentary—The Big Picture
If you look at overall trends for the stock market, they are bullish but flirting with normal. The Market SQN is way down from its high earlier this year while the S&P 500 is still very near its all-time high. Is this a bullish or tired market?
Despite a relatively weak dollar, gold and silver are not strong at all, however, there is little sign of inflation around (except from the shadowstats.com folks).
The fundamentals of our economy are as weak as ever and are just being supported by the Federal Reserve QE process.
And that’s the big picture in a nutshell.
Debt Clock
The State of the United States |
Month Ending |
National Debt |
Federal Tax Revenue |
Federal Spending |
Trade Deficit |
Debt Per Family |
Unfunded Liabilities |
Workforce (taxpayers) |
People supported by them |
July 31 2012 |
$15.93 trillion |
$2.364 trillion |
$3.632 trillion |
$810 billion |
$684,405 |
|
|
|
Dec 30 2012 |
$16.42 trillion |
$2.452 trillion |
$3.540 trillion |
$740.7 billion |
$732,086 |
|
|
|
July 31, 2013 |
$16.89
Trillion |
$2.73
trillion |
$3.535 trillion |
$703 billion |
$748,458 |
Unfunded Liabilities |
115.2 million |
109.9
95.4% |
Dec 31, 2013 |
$17.27 trillion |
$2,82 trillion |
$3,480 trillion |
$692 billion |
$751,294 |
$127.2 trillion |
115.0 million |
108.5M
94.3% |
Jan 31, 2014 |
$17.32 trillion |
$2.84 trillion |
$3.494 trillion |
$676 billion |
$752,026 |
$127.7 trillion |
115.2 million |
108.8M
94.4% |
Feb 28, 2014 |
$17.38 trillion |
$2.86 trillion |
$3.503 trillion |
$683 billion |
$752,554 |
$128.1 trillion |
115.4 million |
108.4M
93.9% |
Mar 31, 2014 |
$17.57 trillion |
$2.89 trillion |
$3.519 trillion |
$683 billion |
$758,057 |
$128.6 trillion |
115.6 million |
107.9M
93.3% |
Apr 30, 2014 |
$17.51
Trillion |
$2.91 trillion |
$3.528 trillion |
$683 billion |
$758,598 |
$128.9 trillion |
115.8 million |
108.8M
94.0% |
May 31, 2014 |
$17.52
Trillion |
$2.93 trillion |
$3.54 trillion |
$689 billion |
$759,341 |
$129.4 trillion |
116.0 million |
104.38M
90.0% |
Right now our total unfunded liabilities are $129.4 trillion (with most of that being Medicare and prescription drug liability) at $89.7 trillion and $22.6 trillion, respectively. Social security unfunded liability is only a little less than our total debt at $17.1 trillion.
The debt situation is so bad that the Federal Reserve has driven short term interest rates to almost zero and long term rates to very low numbers. This is killing the U.S. dollar and interest rates have nowhere to go but up. In fact, betting on eventual higher interest rates is about as close to a certain bet (long term) as you could ever make.
According to the debt clock, our official national debt stands at $17.52 trillion, up $20 billion from the prior month. The US population is at 318.1 million with taxpayers standing at 116 million. The Boomer retirement wave has begun and retirees now stand at 47.6 million. Disabled people collecting social security stands at 11.0 million, while food stamp recipients total 45.8 million, with the last two figures down substantially since last month. Still, that’s 108 million people that are supported by the government (or the 115.8 million taxpayers). But really about 11.6 million taxpayers pay 90% of U.S. taxes. This means that 11.6 million workers are supporting 104 million other people through the government. In addition the top 1% of American tax payers pay 40% of the tax bill. Do these numbers add up to you? Do they seem sustainable?
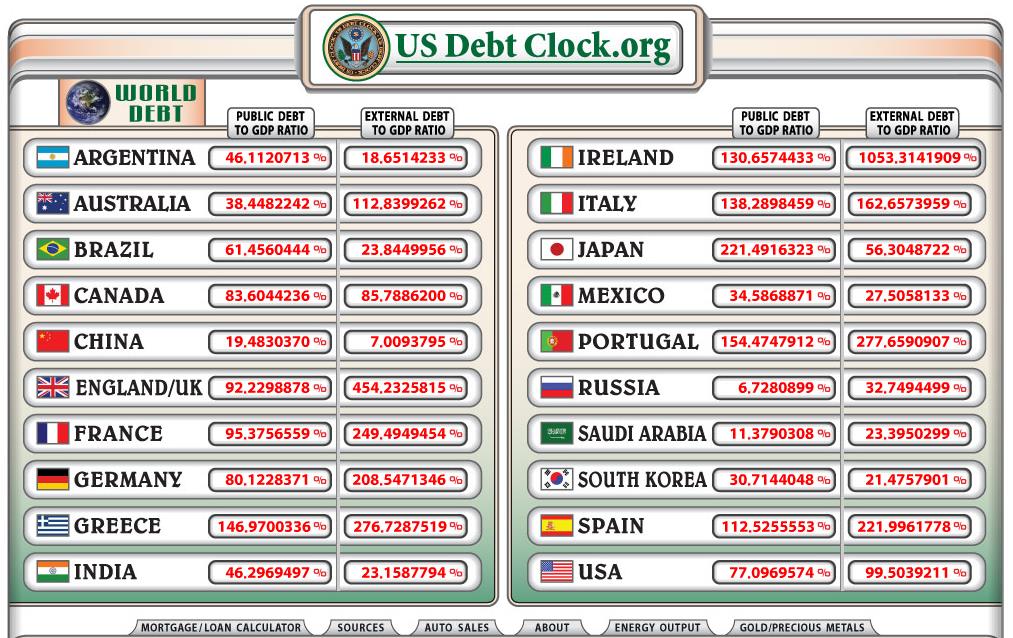
There is a lot of interesting data at US Debt Clock.org including the following graph comparing the US with other countries.
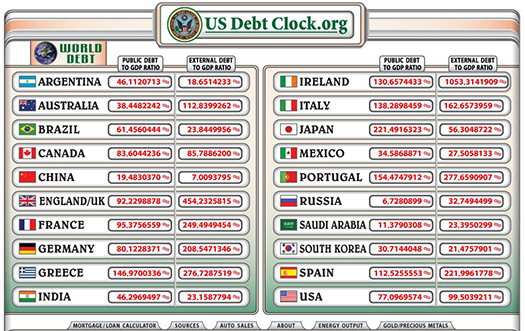
(To see a larger version of this image, click here.)
While our numbers are rather ridiculous with a Debt to GDP figure of 77% and an External Debt to GDP of 99.5, our situation doesn't seem that bad when you contrast it with much of the world. Notice, however, that Russia only has a 6.7% public debt to GDP ratio and a 32.7% external debt to GDP ratio. China is at 18.5% public debt to GDP and a 7.0% External Debt to GDP ratio.
Part II: The Current Stock Market Type Is Bull Quiet
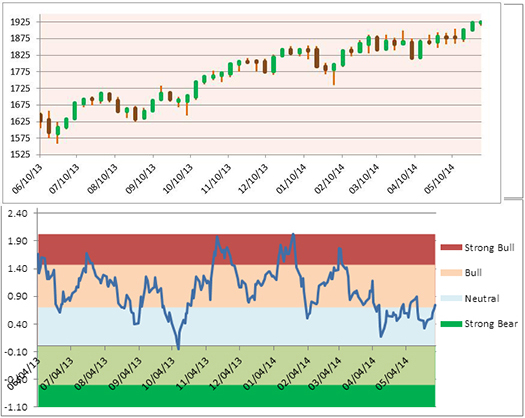
Each month, I look at the Market SQN® score for the daily percent changes in the S&P 500 Index over 200, 100, 50 and 25 days. For our purposes, the S&P 500 Index defines the market. On May 31st, all four figures were in Bull Quiet territory, however, on May 30th the Market SQN for 100 days was Neutral Quiet.
You might ask how the market could be setting new all-time high closes when the Market SQN is only just above the bull territory line. To understand that, look at the following table. It shows the six dates in May in which we set all time high closes on the S&P 500. Notice the last column which shows the Range% change over the last 100 days. This answers the question, by what percentage has the S&P 500 gone up by over the last 100 days.
Date |
New All Time High Close |
Market SQN (100 days) |
Range Change % |
5/30/14 |
1923.57 |
0.75 -Bull |
4.89% |
5/29/14 |
1920.03 |
0.69 - Neutral |
4.84% |
5/27/14 |
1911.91 |
0.50 -Neutral |
3.44% |
5/23/14 |
1900.53 |
0.47 - Neutral |
3.23% |
5/13/14 |
1897.45 |
0.90 - Bull |
6.54% |
5/12/14 |
1896.65 |
0.85 - Bull |
6.16% |
(To see the three following charts stacked and aligned, click here.)
Volatility
Market volatility is back into the quiet range.
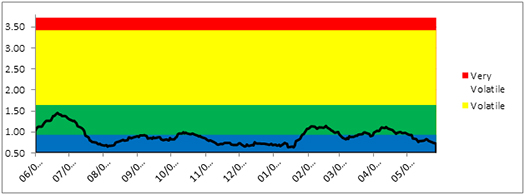
(To see the three previous charts stacked and aligned, click here.)
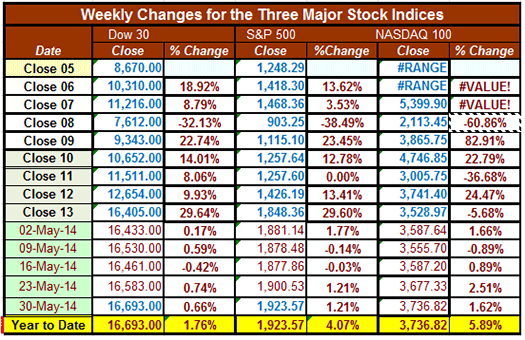
Below is a chart of the weekly changes in the three major US Indices. All three indices are up for the year, but not by a lot. For a year that set 14 record high closes so far, very little has happened really. And the range change % says it all. We’re making new high closes while the S&P 500 is only going up 3-6% in a 100 day period.
Part III: Our Four Star Inflation-Deflation Model
In the simplest terms, inflation means that stuff gets more expensive, and deflation means that stuff gets cheaper. There’s a correlation between the inflation rate and market levels, so the inflation rate can help traders understand big-picture processes.
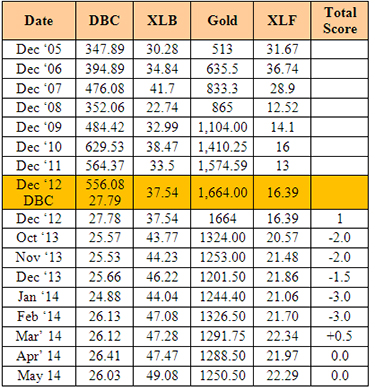
Looking back over the most recent two-month and six-month periods provides the current month’s score, given in the table below.
Month |
DBC2 |
DBC6 |
XLB2 |
XLB6 |
Gold2 |
Gold6 |
XLF2 |
XLF6 |
Total Score |
|
Lower |
Higher |
Higher |
Higher |
Lower |
Lower |
Lower |
Higher |
|
Feb 14 |
|
+1/2 |
|
+1 |
|
-1 |
|
-1/2 |
0.0 |
March was the first time in the last 14 months that we saw any move toward inflation, although it was not a strong one. Our score was zero this month for the second time in a row, so inflation is certainly not a concern. Deflation has been predominant, as we continually point out, because banks are not lending.
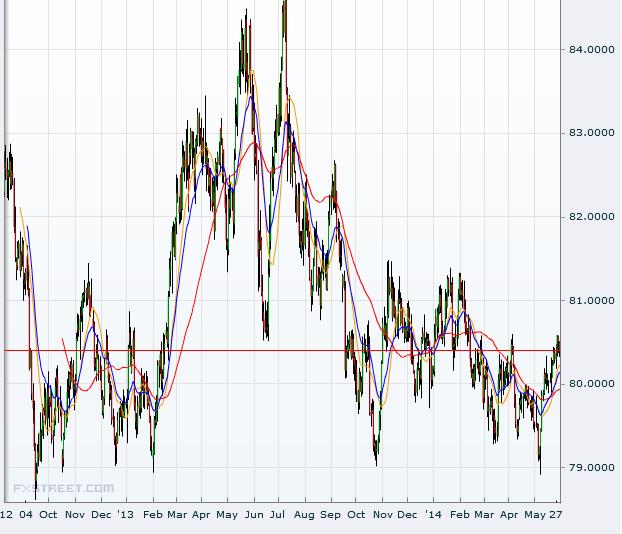
Part IV: Tracking the Dollar
New laws are scheduled to take effect in July which basically make foreign financial firms police US citizens or face a 30% fee on the sale of their U.S. assets. The U.S. government seems to think it is fighting a tax war against its citizens. But what it’s really doing is making it impossible for Americans abroad to open a bank account or just keep existing ones open. Foreign banks across the globe (even in our friendly neighbor Canada) are telling Americans that “we don’t want your business”. This makes it harder and harder for the US to compete in the international economy. In fact, the only solution I can see for American corporations is to employ mostly foreigners in order to operate overseas. That’s not good for our trade deficit.
In addition, these new laws could cause a massive flow of money out of the dollar and a broad move away from the US dollar as the world’s reserve currency. It could certainly cause a massive exit of foreign money from U.S. markets. And maybe none of these things will happen, even though logically, it appears to be a very dangerous move by our government. We’ll have to see what actually happens and that will be soon.
This month I loaded a two year chart of the US dollar. While it’s up slightly from the lows in the 79 range at the end of the month, it’s down over the past year from about 84 to the current range of 80. This range is quite dangerous for the dollar and it is dangerous for the US stock market.
General Comments
Just a reminder that the Market SQN high for the year was on January 14th when it hit 2.02. Right now it’s just about at the dividing line between Neutral and Bull at about one third of the high score in January. We have had 14 new high closes in 2014, despite the S&P 500 only going up 75.21 points since January 1 or 4.07%. We have had six new high closes in May 2014, despite the S&P 500 only going up 2.1% in May. This is not an exciting market.
We tend to get new highs with low range changes just before major market tops. We did in 2001 and in 2007. But the market can also behave like this and then start going up rapidly again. So let the market tell you what it is doing.
By the way, the US government is now doing more statistical manipulations. While they say they want to improve the economy, politicians do everything they can to hinder the economy through stupid laws and deficit spending and thus they have no control. As a result, they do the next best thing; they manipulate statistics to make the economy seem better.
For example GDP growth is defined by growth in the economy less inflation. To keep growth going up strongly, the trick is to eliminate inflation through statistical manipulation. Shadowstat.com says that based upon the way inflation (the CPI) was calculated in 1980, we’ve been in a recession (negative growth) for every quarter but one since 2000. But the government changed the way it measures the CPI so that it looks like we are not in a recession.
At this point, the government can’t do much more with the CPI (well, they probably can but not meaningfully any more), so now they’ve redefined growth. They’ve added some arbitrary value for new patents and copyrights filed in the US so that growth looks better now. What will happen next?
Here’s my prescription for growth in the US:
1) Kill deficit spending immediately by stopping wars and spending on what we mistakenly call “defense.” We can’t afford to be the world peace keeper any more. And I’m pretty sure we spend more than a trillion per year on “defense.”
2) Make sure no more deficit spending continues by passing a law calling for an election of new politicians any year the government cannot spend within their means. (I heard this first from Warren Buffet and borrowed it).
3) Right now, the U.S. education system cannot compete with those of many other countries except at the university level. And our best universities are filled with brilliant foreign students. Great, let’s accept the situation as it is and allow the brilliant foreign students who get masters and Ph.D. degrees to immediately become U.S. citizens instead of forcing them to return to their own countries to use the skills abroad that they learned here.
4) Give a $50,000 tax rebate to any US citizen getting a Ph.D. in the United States to help them pay for their education or their education loans.
4) Allow US companies to compete in the world in a big way by eliminating the tax of the foreign earnings of US citizen living abroad. Taxing foreign earnings of US citizens living in the US is fine, but not those who must live abroad to help our corporations grow and who must also pay foreign tax on their earnings.
5) Reduce the corporate income tax rates from some of the highest levels in the world to competitive levels. Do this by not taxing foreign earnings from US corporates that are used to stimulate the economy. This would eliminate the US trade deficit fairly quickly.
Until next month’s update, this is Van Tharp.
About the Author: Trading coach and author Van K. Tharp, Ph.D. is widely recognized for his best-selling books and outstanding Peak Performance Home Study Program—a highly regarded classic that is suitable for all levels of traders and investors. You can learn more about Van Tharp at www.vantharp.com. His newest book, Trading Beyond The Matrix, is available now at matrix.vantharp.com.
Workshops
Combo Discounts available for all back-to-back workshops!
See our workshop page for details.
Trading Tip
May 2014 SQN Report
by Van K. Tharp, Ph.D.
There are numerous ETFs that now track everything from countries, commodities, currencies and stock market indices to individual market sectors. ETFs provide a wonderfully easy way to discover what’s happening in the world markets. Consequently, I now apply a version of my System Quality Number® (SQN®) score to measure the relative performance of numerous markets in a world model.
The Market SQN score uses the daily percent change for input over a 100-day period. Typically, a Market SQN score over 1.47 is strongly bullish and a score below -0.7 is very weak. The following color codes help communicate the strengths and weaknesses of the ETFs in this report:
- Dark Green: ETFs with very strong SQN® 100 scores > 1.47
- Light Green: ETFs with strong SQN 100 scores (0.70 to 1.47).
- Yellow: ETFs with slightly positive Market SQN scores (0 to 0.70). These are Neutral/Sideways
- Brown: ETFs with slightly negative Market SQN scores (0 to -0.7).
- Red: Very weak ETFs that earn negative Market SQN scores (< -0.7).
The world market model spreadsheet report below contains most currently available ETFs; including inverse funds, but excluding leveraged funds. In short, it covers the geographic world, the major asset classes, the equity market segments, the industrial sectors and the major currencies.
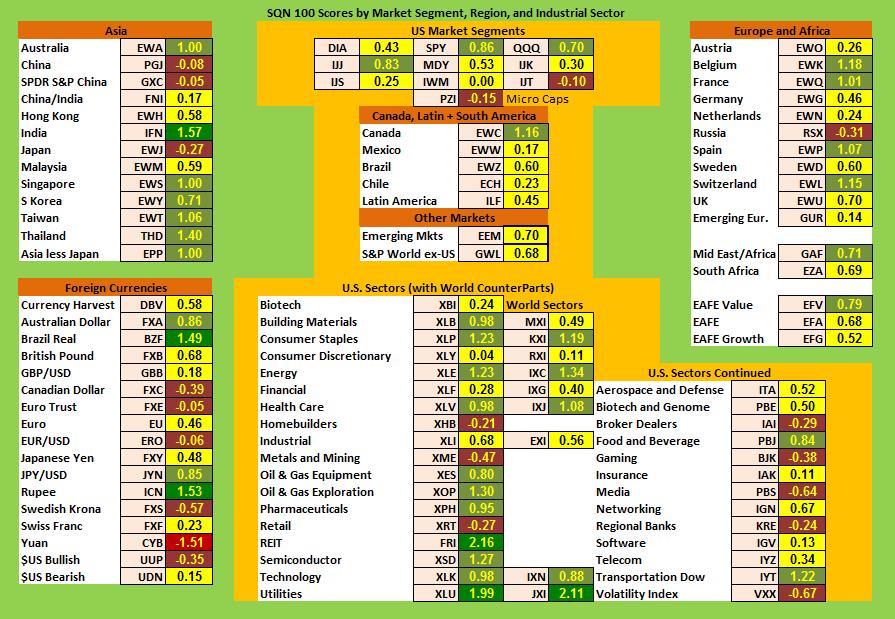
World Market Summary
Each month, we look at the equities markets by segment, region and sector. Most of the world’s countries are now light green or yellow with a few being brown. All of the US sectors are now either light green or yellow, with the exception of microcaps and small growth stocks which are brown. The rest of the Americas are neutral except for Canada which is light green. Europe is neutral to slightly bullish, excluding Russia which is negative. In Asia, however, Japan and China are weak but India is super hot and much of the region has turned bullish (Malaysia, Singapore, Taiwan, Thailand, and Australia).
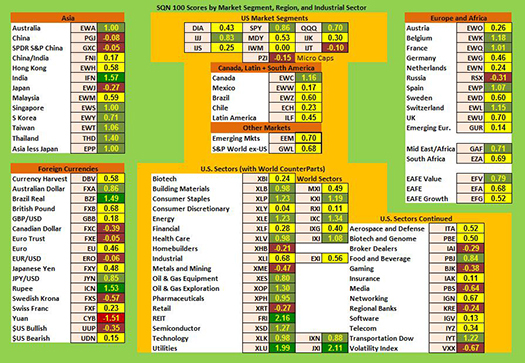
(To see a larger version of this chart, click here.)
From a sector standpoint, we are mostly yellow and light green. REITs and Utilities are very strong. Building Materials, Consumer Staples, Energy, Health Care, Oil and Gas Equipment and Exploration, Pharmaceuticals, Semiconductors, and Technology are all bullish. Home Builder, Brokers (in this climate of new highs), Gaming, Media, Regional Banks, Volatility and Retail are all negative.
In currencies, the Yuan is extremely weak. In addition, the Canadian Dollar, the Euro, the Swedish Krona, and the US Dollar are all negative. The Japanese Yen and the Aussie Dollar are starting to turn bullish. And the British Real and the Rupee are strong.
Commodities, Real Estate, Debt, Top and Bottom Lists
The next chart shows real estate, debt instruments, commodities plus the top and bottom ETFs for the past 100 days.
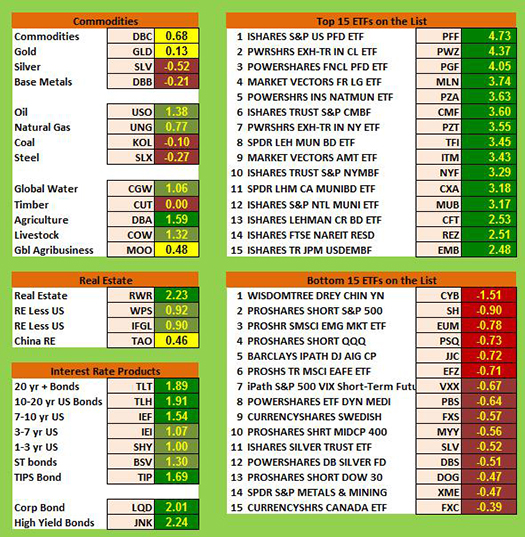
Agriculture is the only dark green commodity. Oil, Natural gas, livestock and global water are all light green. Commodities, gold, and global agribusiness and neutral. Silver, base metals, coal, and steel are all negative.
US real estate is now very strong, and Chinese real estate has gotten stronger, moving to neutral. All the interest rate sectors are positive, with Junk Bonds and Corporate bonds actually being dark green and above 2.0. Interestingly, long term bonds are stronger than short term bonds for the third month in a row. Some people don’t seem to understand what’s going on in the world or they are making short term plays. And some financial guru’s are now saying that interest rates can sustain these low levels for a long time and have become a new normal. I guess when you get hammered you just change your stance.
In the top market SQN scoring ETFs, three issues made Market SQN scores above 4.0 which occurs very seldom. And we have 9 more above 3.0. This is the strongest top 15 group since I’ve been going through this monthly process. Particularly strong ETFs include: PFF (preferred stock); PWZ (California Muni bond); and PGF (financial preferred stocks). I mentioned that last month was the first time I’ve seen all 15 above 2.0. Well now 9 of the 15 are above 3.0.
Only one of the 15 weakest ETFs is below -1.0 — the Chinese Yuan. Weak areas continue to include currencies and short funds.
Summary
Now let’s look at our newest table which measures the percentage of ETFs in each of the strength categories. Based upon this, 59% of the ETFs we track are either bullish or very bullish. And only 13.6% are bearish or very bearish. The S&P 500 continues to set new closing highs.
Date |
Very Bullish |
Bullish |
Neutral |
Bearish |
Very Bearish |
|
> 1.5 |
0.75 - 1.5 |
0 - 0.75 |
0 - -0.7 |
< - 0.7 |
January 31st |
27.1% |
39.6% |
20.7% |
6.4% |
4.7% |
February 28th |
10.3% |
45.2% |
24.4% |
11.9% |
7.5% |
March 31st |
39.2% |
25.5% |
19.1% |
9.0% |
6.4% |
April 30th |
49.1% |
21.1% |
14.8% |
8.0% |
6.2% |
May 31st |
29,2% |
23.6% |
19.9% |
12.3% |
14.2% |
June 30th |
2.1% |
31.0% |
23.2% |
22.0% |
20.9% |
July 31st |
8.2% |
33.5% |
29.0% |
13.3% |
15.2% |
August 30th |
1% |
15% |
46.4% |
19.3% |
17.5% |
Sept. 30th |
1% |
13.8% |
42.3% |
23.0% |
19.1% |
Nov. 1st |
13.3% |
48.3% |
21.8% |
12.5% |
3.3% |
Dec 1st |
14.6% |
42.7% |
24.2% |
13.3% |
4.3% |
Dec 31st |
19.3.% |
45.5% |
22.0% |
11.3% |
2.9% |
January 31st |
8.0% |
49.3% |
20.7% |
12.7% |
7.6% |
February 28th |
18.9% |
48.4% |
18.1% |
6.2% |
6.8% |
March 31st |
4.9% |
40.2% |
38.8% |
13.3% |
3.1% |
April 30th |
11.1% |
33.9% |
40.2% |
11.3% |
1.8% |
May 31st |
12.5% |
46.5% |
27.7% |
7.6% |
6.0% |
What's Going On?
The economic fundamentals are still terrible but the stock market seems to be one of the key places to be—even though a bear market could be right around the corner. Don’t act, however, according to what you think will happen. Instead, act based upon what is happening. And be careful.
Until July, this is Van Tharp.
The markets always offer opportunities, but to capture those opportunities, you MUST know what you are doing. If you want to trade these markets, you need to approach them as a trader, not a long-term investor. We’d like to help you learn how to trade professionally because trying to navigate the markets without an education is hazardous to your wealth.
All the beliefs given in this update are my own. Though I find them useful, you may not. You can only trade your own beliefs about the markets.
New
 Beat the market and even earn absolute returns with these longer-term trading systems. You can now stream the digitally recorded Core Trading Systems Workshop and download the companion documents for a special introductory price. Learn five trading systems from the dynamic Dr. Ken Long in your own space, at your own pace! Beat the market and even earn absolute returns with these longer-term trading systems. You can now stream the digitally recorded Core Trading Systems Workshop and download the companion documents for a special introductory price. Learn five trading systems from the dynamic Dr. Ken Long in your own space, at your own pace!
One of the primary objectives of longer-term systems is that they require less management than shorter term systems. Ken's Core Systems can be operated outside of market hours in less than an hour per month.
At $1,295 it's half the cost of the live workshop. Plus, for a limited time...
...we are releasing it for only $995!
Buy Now
We've complied all you need to know about this new offering. Go to www.vantharp.com/products/core-workshop-video-home-study.asp
For a short video overview about the course, click here.
Matrix
Matrix Insight Entries
--------------------------------------------------------
Let me first say how much I enjoyed reading your latest book: “Trading Beyond the Matrix” and it occupies an important place in my trading library along with one of your earlier books: “Trade Your Way...”. The principles of position sizing and expectancy along with “Tharp Think” have given me valuable insight and discipline to my trading career. I heard you speak some years ago at the conference of the Australian Technical Analysts Association in Melbourne Australia and enjoyed playing your marble game.
The most important insight I gained from your book was the importance of listening to my inner voice and that by creating the right circumstances, we can tune in to our inner voice when we need to. I have heard my inner voice before (it told me some years ago to quit smoking which I did & have never had a single cigarette since) but have only ever believed that it was a chance thing that only happened rarely and unexpectedly. But to realize that our inner voice can be called upon by creating the right circumstances of relaxation and silence has been a great benefit to me in times of anxiety or when confronting perplexing problems.
I have come to realize the importance of our inner voice as an internal guidance system to keep us on the correct path we must follow if we are to be successful as traders. It has helped me to tune out from all the noise and rubbish that bombards us from the so called “experts” in the popular media. As a result of reading “Trading Beyond the Matrix” I now have a much clearer focus on what I want to achieve with my trading and how to go about it. ( which I realize is not entirely about money ) Thank you for writing and publishing a most important book.
Yours Sincerely,
Jim
B.
--------------------------------------------------------
The one thing or chapter in the Matrix that had the most significant effect on me was the story by the 45-year-old German engineer. It took me a while to get to chapter 14 because I got really stuck in chapter 10 and 11. While reading those chapters the book completely fell apart for me. For a month or so the book was an effective sleeping pill right by the bed. Just trying to get ahead made me fall asleep immediately.
However I continued reading and on a holiday with my family in Spain in February this year I was struggling emotionally with my job situation and personal concerns as well. One night, I could not sleep, so I got up and read Chapter 14. This guy was very easy for me to relate to — fact oriented, no nonsense engineer, good with numbers and an intuitive sense for potential failures wherever he looked. I am that type of guy, with a built-in “need to be right bias” and a perfectionist attitude. Credibility is a core value for me and being in situations in which I am not feeling credible or uncertain is most tiresome for me. I have carried these beliefs about myself with me all the way from childhood to finishing my Ph.D. in applied multivariate data analysis. Fear of failure has been the driver for completing scientific work and finally achieving the degree.
Fear of failure has actually been a life companion and a major driver in many aspects of my life. Half way through my Ph.D. I was so sick of it that I thought of quitting, but fortunately I stumbled upon one of Robert T. Kiyosakis books speaking of assets and liabilities. I realized that I had only liabilities and that the only valuable potential asset in sight was to finish my Ph.D.. Once acquired, no one could take it away again. With that thought or belief in my mind I stood through the struggles and finished the job.
Although I am quite happy and proud of this achievement it has not changed my beliefs and biases — it rather keeps me in roles where complicated problem solving is assigned to me although I often find it to be “hard work” similar to the story of the German engineer.
After working my way through chapter 14 in the middle of the night on a mountain side in Spain I thought to myself: is a higher power a useful belief? Hm — could be. So I started a conversation in my head asking simple questions and writing down both questions and answers. The experience was surprisingly easy and natural. The “voice” or “thought” answering felt like being myself answering — but not in a speculative way — rather in a short clear and clarified way. I got straight answers regarding job concerns that gave me specific possibilities of actions — effectuated a few days later.
On the same holiday I started on “A Course in Miracles”. I realized that it takes some discipline to keep up the pace but I really like the short exercises during the day. They work like small meditations — a short focus on the days idea — and then back on to the daily doings. I find that the exercises bring perspective to the present and a sense of peace. In addition to this I downloaded a guided meditation from itunes from my teenage years and early twenties, where I had established a practice of meditation and yoga through the Scandinavian Yoga and Mediation School (yoga.dk). The meditation is called “Yoga Nidra”. Using it again for the first time in 20 years or so felt a bit like coming home. The ideas and beliefs I was engaged in at the time were still very useful and relevant in the transformation that I believe has started as a result of reading “Trading beyond the Matrix”.
How does all this reflect on my trading? I have been working on developing a system that fits me for the last 2-3 years. I spend the first 1-2 years to figure out — what does actually fit me? I have found out by trial and error that day-trading and swing trading with daily attention is certainly not for me at this time — considering family and job constraints. I have time and discipline for a weekly routine. For the last year I have been working on a rotation system that fits my beliefs about the market and my knowledge of statistics. The last few months the system has taken form in my head and in my weekly routines. Current forward testing apparently works well and fits my belief that all markets are always trending at all time frames. These trends can be described by a few features and their variation and converted into a score that gives me a basis for weekly decisions. After implementing the system in 2014 it has provided only two portfolio changes and no losses. This is good considering number of trades with the system should be kept very low — due to trading costs in the mutual funds universe were my pension funds are traded.
At the end of the day — I believe that the pieces are coming together and that the process has been helped along with your book and especially through bringing the story of the German engineer. My early yoga and meditation experiences, my capabilities and interest statistics and sampling, my interest for trading and solving fun and challenging problems with big random components with peace of mind are coming together. And the biggest insight for me is that my beliefs are plastic and the future may even contain contact with higher powers while also achieving freedom through my own trading systems.
Erik T.
Only Accepting a Few More Entries in the  Matrix Contest Matrix Contest
Enter for a chance to win a free workshop!
We want to hear about the one most profound insight that you got from reading Van's new book, Trading Beyond the Matrix, and how it has impacted your life. If you would like to enter, send an email to [email protected]. Our goal of receiving 25 qualifying entries is almost met. We will take 7 more entries and close the contest.
If you haven't purchased Trading Beyond the Matrix yet, click here.
For more information about the contest, click here.
Ask Van...
Everything we do here at the Van Tharp Institute is focused on helping you improve as a trader and investor. Consequently, we love to get your feedback, both positive and negative!
Send comments or ask Van a question by clicking here.
Also, Click here to take our quick, 6-question survey.
Back to Top
Contact Us
Email us at [email protected]
The Van Tharp Institute does not support spamming in any way, shape or form. This is a subscription based newsletter.
To change your e-mail Address, e-mail us at [email protected].
To stop your subscription, click on the "unsubscribe" link at the bottom left-hand corner of this email.
How are we doing? Give us your feedback! Click here to take our quick survey.
800-385-4486 * 919-466-0043 * Fax 919-466-0408
SQN® and the System Quality Number® are registered trademarks of the Van Tharp Institute
Be sure to check us out on Facebook and Twitter!
 
Back to Top |