Tharp's Thoughts Weekly Newsletter (View On-Line)
-
Article Market Update, Market Condition: Bull Quiet by Van K. Tharp, Ph.D.
-
-
Trading Tip November 2013 SQN Report by Van K. Tharp, Ph.D.
Last Day to Receive FREE SHIPPING on our Two Home Study Courses Plus,
The 20% Off Sale is Still Valid on All Products

See all Sale Items
At midnight tonight (Dec 4), our Cyber Monday free shipping offer on The Peak Performance Home Study and/or the How to Develop A Winning Trading System Home Study will expire.
Order now to take advantage of the discount!
- International orders will Ship USPS and US orders will ship UPS.
- International customers please allow up to three weeks for delivery once the item has shipped.
- If you add other products to your order shipping charges will be applied for those items.
Learn more...
Please note, sale prices cannot be combined with any coupons.
Article
Market Update for the Period Ending November 30, 2013
Market Condition: Bull Quiet
by Van K. Tharp, Ph.D.
View On-line
I always say that people do not trade the markets; they trade their beliefs about the markets. Consequently, I'd like to point out that these updates reflect my beliefs. I find the market update information useful for my trading, so I do the work each month and am happy to share that information with my readers.
If, however, your beliefs are not similar to mine, then this information may not be useful to you. If you are inclined to perform some sort of intellectual exercise to prove one of my beliefs wrong, simply remember that everyone can usually find lots of evidence to support their beliefs and refute others. Know that I acknowledge that these are my beliefs and that your beliefs may be different.
These updates are in the first issue of Tharp's Thoughts each month. This allows us to get the closing month's data. These updates cover 1) the market type (first mentioned in the April 30, 2008 edition of Tharp's Thoughts and readable on our web site), 2) the five-week status on each of the major U.S. stock market indices, 3) our four star inflation-deflation model plus John Williams' statistics, and 4) the movement of the dollar. I now report on the strongest and weakest areas of the overall market in a separate SQN® Report. I may come out with that report twice a month if there are significant market changes.
—Van K. Tharp
Part I: Commentary—The Big Picture
We’ve been in a bull market for some time. Since the runup started in 2009, we have not had even a 10% correction. The Dow has hit 16,000 (but you have to remember that the components of the Dow were changed before that occurred). Since 2009, the Fed has been pumping money into the financial system and it basically goes straight into the stock market. When adjusted for inflation figures (from the US government), however, the Dow is still below its 2000 peak. Additionally, Richard Russell says the S&P 500 (which is more reflective of the economy) would still have to go up by 16% to make a new inflation adjusted high.
The Fed may employ a new tool to make adjustments. They can adjust the rate of interest they currently pay on the deposits banks place with them. That rate is currently at 0.25%, and the Fed is thinking about reducing it to zero. In other words, it’s telling banks to keep their money and invest it elsewhere. Now, banks are retaliating by threatening to charge depositors to hold their money.
These are some of the reasons why I can say we’re in a secular bear market. And I still expect PE ratios for the S&P 500 to be in the single digit range before the secular bear market ends. If the Fed continues to create dollars faster than we are creating debt, then our debt will be manageable. But this will, of course, create hyperinflation.
The U.S. finances are a total mess. The Federal Reserve has now decided that we are “under-inflating” meaning they are concerned about deflation. Thus, they have given themselves “carte blanche” to continue QE and zero short-term interest rates. The stimulus money tends to go into the stock market because the big banks are putting the money there rather than lending it. So in one sense, expect a continual boom in the stock market. However, the Fed’s guidance and actions suggest that it does not even have an exit strategy in place to stop QE. When the Fed hints of stopping, it will send the market into a tailspin. And if it raises interest rate by just 1%, it means a huge increase in interest costs for the US government.
In addition, Bloomberg announced that the People’s Bank of China will stop dollar purchases that limit the Yuan’s appreciation. China now has $1.294 trillion in foreign reserves invested in the dollar and their plan seems to be to maintain that level. It also means that they will invest their excess assets into other currencies such as the Yuan or other asset classes such as gold. Current estimates put China’s gold holdings at about 4,800 tons. The total world supply is probably about 40,000 tons.
Large investors, however, don’t seem to be believers in deflation because they are now moving into every kind of tangible asset. These include all sorts of collectibles such as great art, jewelry, farmland, classic cars, etc. Works of art are starting to go for over $100 million. What about rare stamps which I’ve been touting for some time? I’m an old time collector.
Yes, we’re in a bull market but it’s a bull market denominated in the US dollar. Its reign as the world’s reserve currency could easily end. Indeed, Gabriel Grammatidis, who teaches our Forex course, predicts that the Yen, Euro, and the US Dollar will all collapse (long term), possibly in that order. So then does the Yuan take over?
Let’s look at the state of the United States chart courtesy of the debt clock. One month was missed while I was gone, but it’s not that important as the trends are obvious.
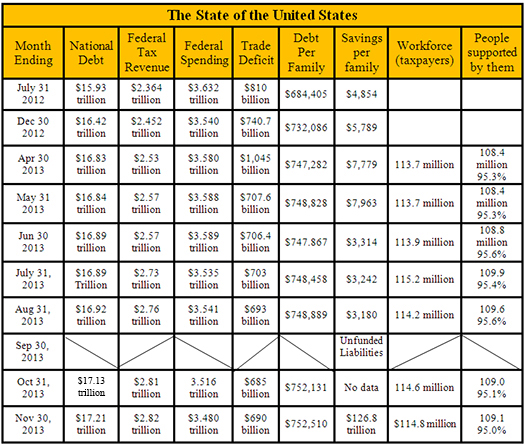
They have changed the US debt clock website a little to include US unfunded liabilities. I’m going to start using that column instead of savings per family. Right now, our total unfunded liabilities is $126.8 trillion, with most of that being Medicare and prescription drug liability — $88 trillion and $22 trillion, respectively. The social security unfunded liability is only a little less than our total debt at $16.7 trillion.
Today, our official debt is over $17 trillion, up $80 billion from the previous month and it’s going up a trillion every year. Furthermore, the debt situation is so bad that the Federal Reserve has had to drive short-term interest rates to almost zero and long-term rates to very low numbers. This is killing the U.S. dollar and interest rates have nowhere to go but up. In fact, betting on eventual higher interest rates is about as close to a certain bet (long term) as you could ever make, however, such a bet might be similar to shorting “dotcom” stocks in early 1999. You could experience a lot of pain before you reap your windfall.
The US population remains at 316 million with taxpayers standing at 114.8 million. The Boomer retirement wave is in its earliest stages, as retirees now stand at 46.9 million. Disabled people collecting social security stands at 14.4 million, while food stamp recipients total 47.8 million with all three of those group being up over the previous month. So that’s 109.1 million people that are supported either by the government or the 114.8 million taxpayers. But really about 11 million taxpayers pay 90% of U.S. taxes. This means that 11.5 million workers are supporting 109 million other people through the government. Do these numbers add up to you? Do they seem sustainable?
Part II: The Current Stock Market Type Is Bull Quiet
Each month, I look at the market SQN® score for the daily percent changes in the S&P 500 Index over 200, 100, 50 and 25 days. For our purposes, the S&P 500 Index defines the market.
The 200-day market SQN remains in strong bull mode, while the 100, 50, and 25-day SQN scores are all just in the bull range. Market volatility is very quiet and this, for now, keeps us very safe.
(to see the three following charts stacked and aligned, click here)
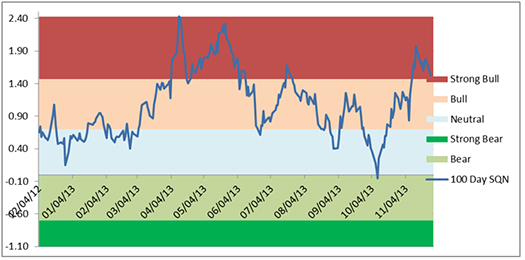
You can see that we had a few weeks in the strong bull range, and then retreated back into bull.
(to see the three previous charts stacked and aligned, click here)
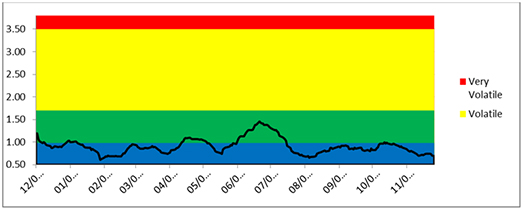
And the last chart is our volatility chart. You can see that it’s been a long time since we have been in any way volatile.
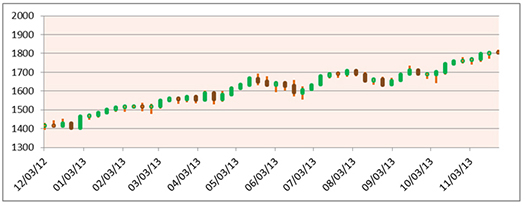
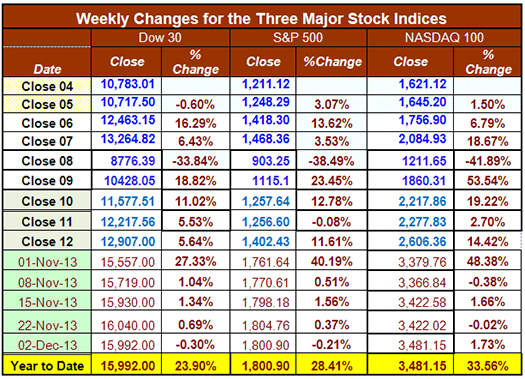
Below is a chart of the weekly changes in the three major US Indices. As you can see, all three indices are up substantially on the year with better than 20% gain. The S&P 500 is up nearly 30% and the NASDAQ 100 is over 30% (despite AAPL). Has your performance been as good as the indices this year?
Part III: Our Four Star Inflation-Deflation Model
In the simplest terms, inflation means that stuff gets more expensive, and deflation means that stuff gets cheaper. There’s a correlation between the inflation rate and market levels, so the inflation rate can help traders understand big-picture processes. As a result of the CRB:CCI index discontinuing on April 17th, 2013, I switched the commodity price component of the model to the ETF called DBC. I have kept the prior years’ CCI data (from 2005 to 2012) as a reference since the DBC data goes back only a few years.
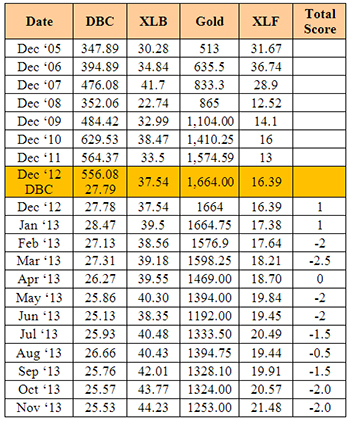
Looking back over the most recent two-month and six-month periods provides the current month’s score, given in the table below.
Month |
CRB2 |
CRB6 |
XLB2 |
XLB6 |
Gold2 |
Gold6 |
XLF2 |
XLF6 |
Total Score |
|
Lower |
Lower |
Higher |
Higher |
Lower |
Lower |
Higher |
Higher |
|
Nov-13 |
|
-1 |
|
+1 |
|
-1 |
|
-1 |
-2 |
Again, it was another month where the deflationary forces seem to be winning. In the last 11 months we have had one inflationary month, 9 deflationary months, and one month at zero. And of course, as we continually point out, one of the reasons is that banks are not lending. The money multiplier put out by the Fed is still at 0.7 rather than the normal 3.0 which indicates the stimulus money is not actually getting out of the banks and into the economy to stimulate it. That’s a deflationary force.
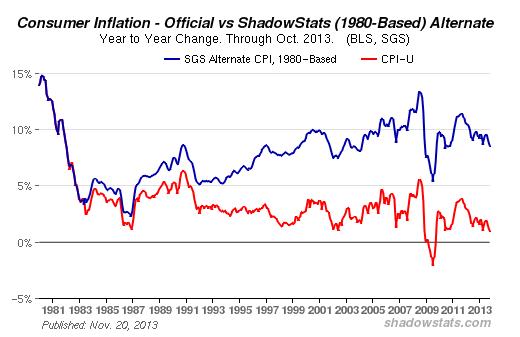
Shadowstats.com, however, publishes real economic data (rather than the government manipulation of the data), and suggests that current inflation is running around 9% (see the chart below).
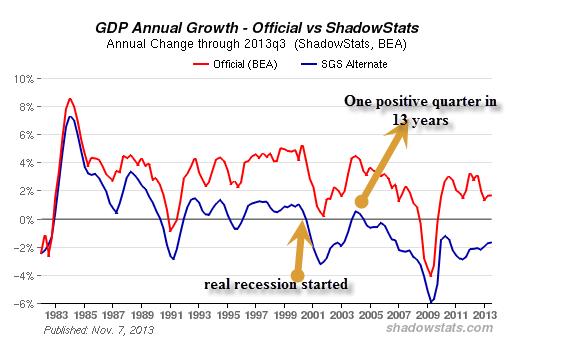
Shadowstats also says that we’ve been in a recession since the secular bull market started (the chart below uses real inflation to calculate GDP growth). Actually, we have had just one quarter in 13 years where we have not been in a recession.
Part IV: Tracking the Dollar
Since its peak in July, the USD has been on a downtrend that recently gathered strength. The large drop came shortly after Fed Reserve Chairman Bernanke announced the continuation of the QE program. The dollar, the Euro, and the Yen are all extremely weak currencies. All three will probably fail, but who knows which one will fall first. The dollar does have some bias for survival since much of the world’s debt is still dollar denominated. However, as the Fed is forced to buy more and more of that debt, the situation will change.
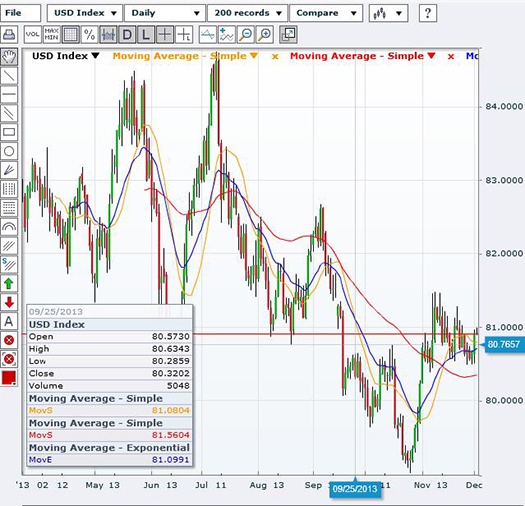
Below is a chart of the US Dollar Index. If it dropped below 78, it would probably be a serious sign.
General Comments
Longer term, the competitive stimulus measures from central banks propels the big picture. Shorter term, multiple markets continue to offer plenty of opportunities to prepared traders. The keys are awareness, preparation, and execution.
On a side note, I have a Ph.D. in biological psychology. I used to be, in effect, a brain researcher. The research models at that time centered on the idea of stimulating the animal (or brain) and looking at the response. I did not see those models as very useful in the late 1970s so I moved out of the field to study investors. I don’t regret that move at all; it’s been fun. If I were to get that same Ph.D. today, however, I’d probably stay in the field because the current research is very interesting to me.
On that note, the latest issue of Science magazine is a special issue dealing with the brain. The last ten pages of the magazine are advertisements looking for qualified brain researchers. Wow. I extended my Ph.D. for a year because one of my colleagues who graduated early in 3.5 years was one of 200 of applicants for a single opening — a $10,000 per year teaching job. Now there are 10 pages worth of ads in Science Magazine for research positions in the brain sciences. But don’t worry, everything I learned is long out of date and even if my brain knowledge was current, I’d never work for anyone else again. Plus, I love what I do.
Until the New Year, this is Van Tharp.
These monthly market updates are not intended for predictive purposes; rather, they’re intended to help traders decide which of their trading systems should work best in the current market conditions. In bear markets—which are almost always volatile by nature—shorter-term strategies, and those that allow going short, tend to work better than long-only or intermediate/longer-term systems.
Which of your trading systems fit this current market type? Of course, this question implies that you have multiple trading systems and that you know how they perform under various market conditions. If you haven't heard of this concept or the other concepts mentioned above, read my book, Super Trader, which covers these areas and more, so that you can make money in any kind of market condition.
Crisis always implies opportunity. Those with good trading skills can make money in this market—a lot of money. There were lots of good opportunities in 2012, and many more to come in 2013. Did you make money? If not, then do you understand why not? The refinement of good trading skills doesn't just happen by opening an account and adding money. You probably spent years learning how to perform your current job at a high skill level. Do you expect to perform at the same high level in your trading without similar preparation? Financial market trading is an arena filled with world-class competition. Additionally, and most importantly, trading requires massive self-work to produce consistent, large profits under multiple market conditions. Prepare yourself to succeed with a deep desire, strong commitment and the right training.
About the Author: Trading coach and author Van K. Tharp, Ph.D. is widely recognized for his best-selling books and outstanding Peak Performance Home Study Program—a highly regarded classic that is suitable for all levels of traders and investors. You can learn more about Van Tharp at www.vantharp.com. His newest book, Trading Beyond The Matrix, is available now at matrix.vantharp.com.
Back to Top
Trading Education
All Three Peak Performance Workshops Back-to-Back in January!
The Peak Performance 101 workshop is a prerequisite for the Super Trader Program and for the more advanced Peak Performance 202 and 203 workshops. These workshops have been selling out early, so don't let the holiday's distract you. If you'd like to come, register now to ensure you have a seat come January!
If you live in South Africa and would for Van to host a workshop there, please contact us at [email protected]. There is a possibility he will be visiting South Africa in early to mid 2014.
Click here to see the full workshop schedule or to register.
Back to Top
Trading Tip
November 2013 SQN® Report
There are numerous ETFs that now track everything from countries, commodities, currencies and stock market indices to individual market sectors. ETFs provide a wonderfully easy way to discover what’s happening in the world markets. Consequently, I now apply a version of my System Quality Number® (SQN®) score to measure the relative performance of numerous markets in a world model.
The Market SQN score uses the daily percent change for input over a 100-day period. Typically, a Market SQN score over 1.45 is strongly bullish and a score below -0.7 is very weak. The following color codes help communicate the strengths and weaknesses of the ETFs in this report:
- Green: ETFs with very strong Market SQN scores (0.75 to 1.5).
- Yellow: ETFs with slightly positive Market SQN scores (0 to 0.75).
- Brown: ETFs with slightly negative Market SQN scores (0 to -0.7).
- Red: Very weak ETFs that earn negative Market SQN scores (< -0.7).
The world market model spreadsheet report below contains most currently available ETFs; including inverse funds, but excluding leveraged funds. In short, it covers the geographic world, the major asset classes, the equity market segments, the industrial sectors and the major currencies.
World Market Summary
Each month, we look at various markets on a global basis including equities, currencies, commodities, debt, and real estate. It’s been a couple of months since I wrote this report and what a difference a couple of months has made.
Looking at the equities markets, we see mostly green with a little yellow in the US and European countries. In the US, the only segment not green is DIA, the Dow Jones Industrials ETF. Europe and Africa are all green except for Russia, Emerging Europe and the Africa funds which are yellow. Asia has a mix of both good and mild strength with China showing exceptional strength for the last 100 days, however, Malaysia and Thailand are both weak.
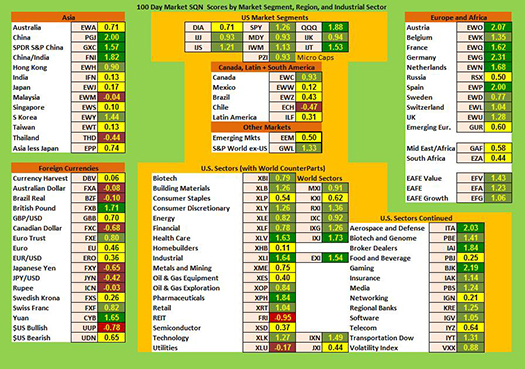
(to see a larger version of this chart, click here)
In the Americas, only Canada is green, while Chile has the worst score, being brown and negative.
From a sector standpoint, we again see mostly green and some yellow. Health Care, Industrials, and Pharmaceuticals are by far the strongest sectors, all being dark green. The negative sectors are REITS and Utilities — where people tend to flock as the market gets weak.
Currencies, on the other hand, show much less strength than equities. Here, there’s a fairly even split between brown and yellow with the Chinese Yuan and the British pound being signs of strength. The US dollar shows up as the weakest currency, being the only red one.
Commodities, Real Estate, Debt, Top and Bottom Lists
The next chart shows real estate, debt instruments, commodities and the top and bottom ETFs for the past 100 days.
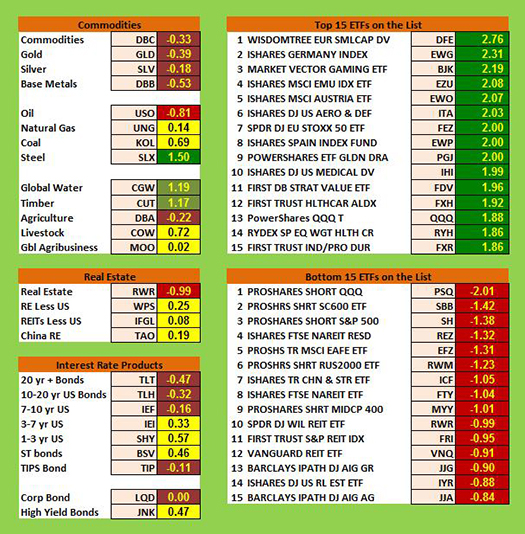
Commodities are still weak with half the sectors showing negative SQN scores. The only relative strong areas here are steel, followed by timber and water.
Real estate went back to being weak, although non-US real estate is pretty neutral.
As for bonds, again it seems like the longer the duration, the weaker the Market SQN score. Across the board, however, the bonds category’s Market SQN scores have come up — they all had very bearish or bearish scores for the last few months. Short term bonds (less than 7 years) and junk bonds are all yellow now (which is neutral).
In the top market SQN scoring ETFs, we have nine groups with SQNs at 2.0 or above. These include Europe small cap dividend, German, gaming, Austria, and even Spain. Most of the negative ETF (with 1 being over -2.0) are short funds. The worst being the short QQQ fund.
Summary
The next table measures the percentage of ETFs in each of the strength categories. Nearly half of the ETFs are in the bullish range. The very bullish percentage is the highest it has been since April. However, overall the picture looks slightly weaker than last month.
Date |
Very Bullish |
Bullish |
Neutral |
Bearish |
Very Bearish |
|
> 1.5 |
0.75 - 1.5 |
0 - 0.75 |
0 - -0.7 |
< - 0.7 |
January 31st |
27.1% |
39.6% |
20.7% |
6.4% |
4.7% |
February 28th |
10.3% |
45.2% |
24.4% |
11.9% |
7.5% |
March 31st |
39.2% |
25.5% |
19.1% |
9.0% |
6.4% |
April 30th |
49.1% |
21.1% |
14.8% |
8.0% |
6.2% |
May 31st |
29,2% |
23.6% |
19.9% |
12.3% |
14.2% |
June 30th |
2.1% |
31.0% |
23.2% |
22.0% |
20.9% |
July 31st |
8.2% |
33.5% |
29.0% |
13.3% |
15.2% |
August 30th |
1% |
15% |
46.4% |
19.3% |
17.5% |
Sept. 30th |
1% |
13.8% |
42.3% |
23.0% |
19.1% |
Nov. 1st |
13.3% |
48.3% |
21.8% |
12.5% |
3.3% |
Dec 1st |
14.6% |
42.7% |
24.2% |
13.3% |
4.3% |
What's Going On?
I’m surprised at the change to bullishness of the world model since I last did the update in September. In September, 14.8% of the database was bullish, while 42.1% was bullish. At the beginning of December, we have 57.3% bullish, and 17.6% bearish. That’s quite a change in several months.
Until the New Year, this is Van Tharp.
The markets always offer opportunities, but to capture those opportunities, you MUST know what you are doing. If you want to trade these markets, you need to approach them as a trader, not a long-term investor. We’d like to help you learn how to trade professionally because trying to navigate the markets without an education is hazardous to your wealth.
All the beliefs given in this update are my own. Though I find them useful, you may not. You can only trade your own beliefs about the markets.
Peak Performance Home Study
The ultimate home study course for traders.
Learn how you think when you make and lose money, how to reduce stress,
how to avoid repeating mistakes, and how to eliminate emotions from trading.
Watch the video below for more information on this revolutionary product.

Now, 20% Off! Only $636.00
Click here for more information.
Ask Van...
Everything we do here at the Van Tharp Institute is focused on helping you improve as a trader and investor. Consequently, we love to get your feedback, both positive and negative!
Click here to take our quick, 6-question survey.
Also, send comments or ask Van a question by clicking here.
Back to Top
Contact Us
Email us at [email protected]
The Van Tharp Institute does not support spamming in any way, shape or form. This is a subscription based newsletter.
To change your e-mail Address, e-mail us at [email protected].
To stop your subscription, click on the "unsubscribe" link at the bottom left-hand corner of this email.
How are we doing? Give us your feedback! Click here to take our quick survey.
800-385-4486 * 919-466-0043 * Fax 919-466-0408
SQN® and the System Quality Number® are registered trademarks of the Van Tharp Institute
Be sure to check us out on Facebook and Twitter!
 
Back to Top |


