Tharp's Thoughts Weekly Newsletter (View On-Line)
-
Article Busted Breakouts in Forex by Gabriel Grammatidis
-
-
Trading Tip Google's Monster Earnings Moves by D.R. Barton, Jr.
-
-
 Busted Breakouts in Forex Busted Breakouts in Forex
by Gabriel Grammatidis
View On-line
Note from the editor: We’ve been getting a lot of question recently about Forex trading. For whatever reasons, some people have the perception that it’s very different than trading other markets. We asked Gabriel if he could help readers understand Forex trading simply by talking a little about one of the systems he trades.
Trading Forex is not so different than trading stocks or futures. There are some nuances, to be sure, but for anyone who has already been trading, picking up on these small differences would be easy. I thought I would share the background for one of the systems I teach to show people that they can understand a Forex system with little explanation and a few charts.
First, understand that currencies tend to be trendy—especially on a shorter-term basis. I have observed this across many currency pairs over a number of years. There would seem to be an obvious edge in a trend-following system that can identify low-volatility consolidation patterns that are likely to break-out into a momentum-driven continuation of the trend. To take advantage of this behavior, I created a low-risk, rules-based system for times when I find that a particular currency pair is trending, respects important lines in charts, and frequently breaks out of low-volatility range consolidations.
Forex System With an Edge — Busted Breakout
According to Tharp Think, a trading system consists of several parts: beliefs behind the system, setup & entry rules, filters, risk definition (1R), exits, and a position sizing strategy™. The following trade example gives only a short description of these parts.
One of the fundamental beliefs behind this system is that price consolidations within a trend are times of “refreshers” (or pauses) required for the trend to regain strength before it can continue. Multi-bar consolidations bring price volatility down and allow for low-risk trading opportunities.
The system benefits from an initial state of low volatility that allows a relatively tight stop at entry. Because the system is based on the psychology of the market participants, it works in all timeframes, from very small to large (from 1 min to daily charts).
Now, let’s have a look at a recent long Busted Breakout trade in the EURUSD on the 5th of April, 2013.
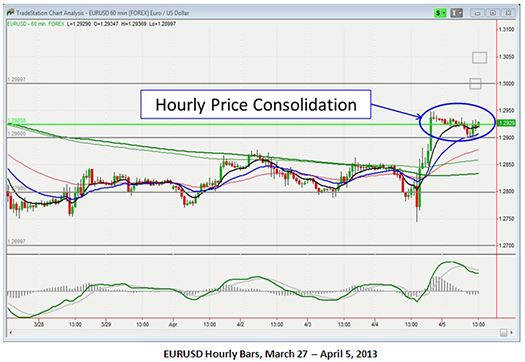
Higher Timeframe Analysis
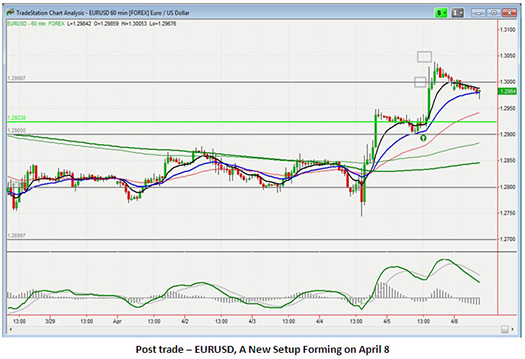
Overall, we see in the 60-minute chart an uptrend in the EURUSD pair determined by higher highs and higher lows. The recent strong momentum move confirms this trend and indicates that trend acceleration might take place from here on out. The moving averages are in a nice trend mode (i.e. 8>21>50>200MA). The current price is in/around the 8 & 21MA, representing a good base for the next momentum move to occur. Target levels are indicated in the chart (grey rectangles—top right) with the conservative target being the round number of 1.3000, and the more aggressive target at 1.3050 (more aggressive target). This overall chart picture might seem to present an obvious low-risk trade opportunity.
To see larger versions of the following charts, click here.
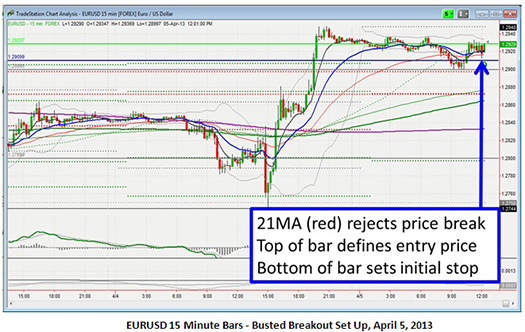
Setup & Entry
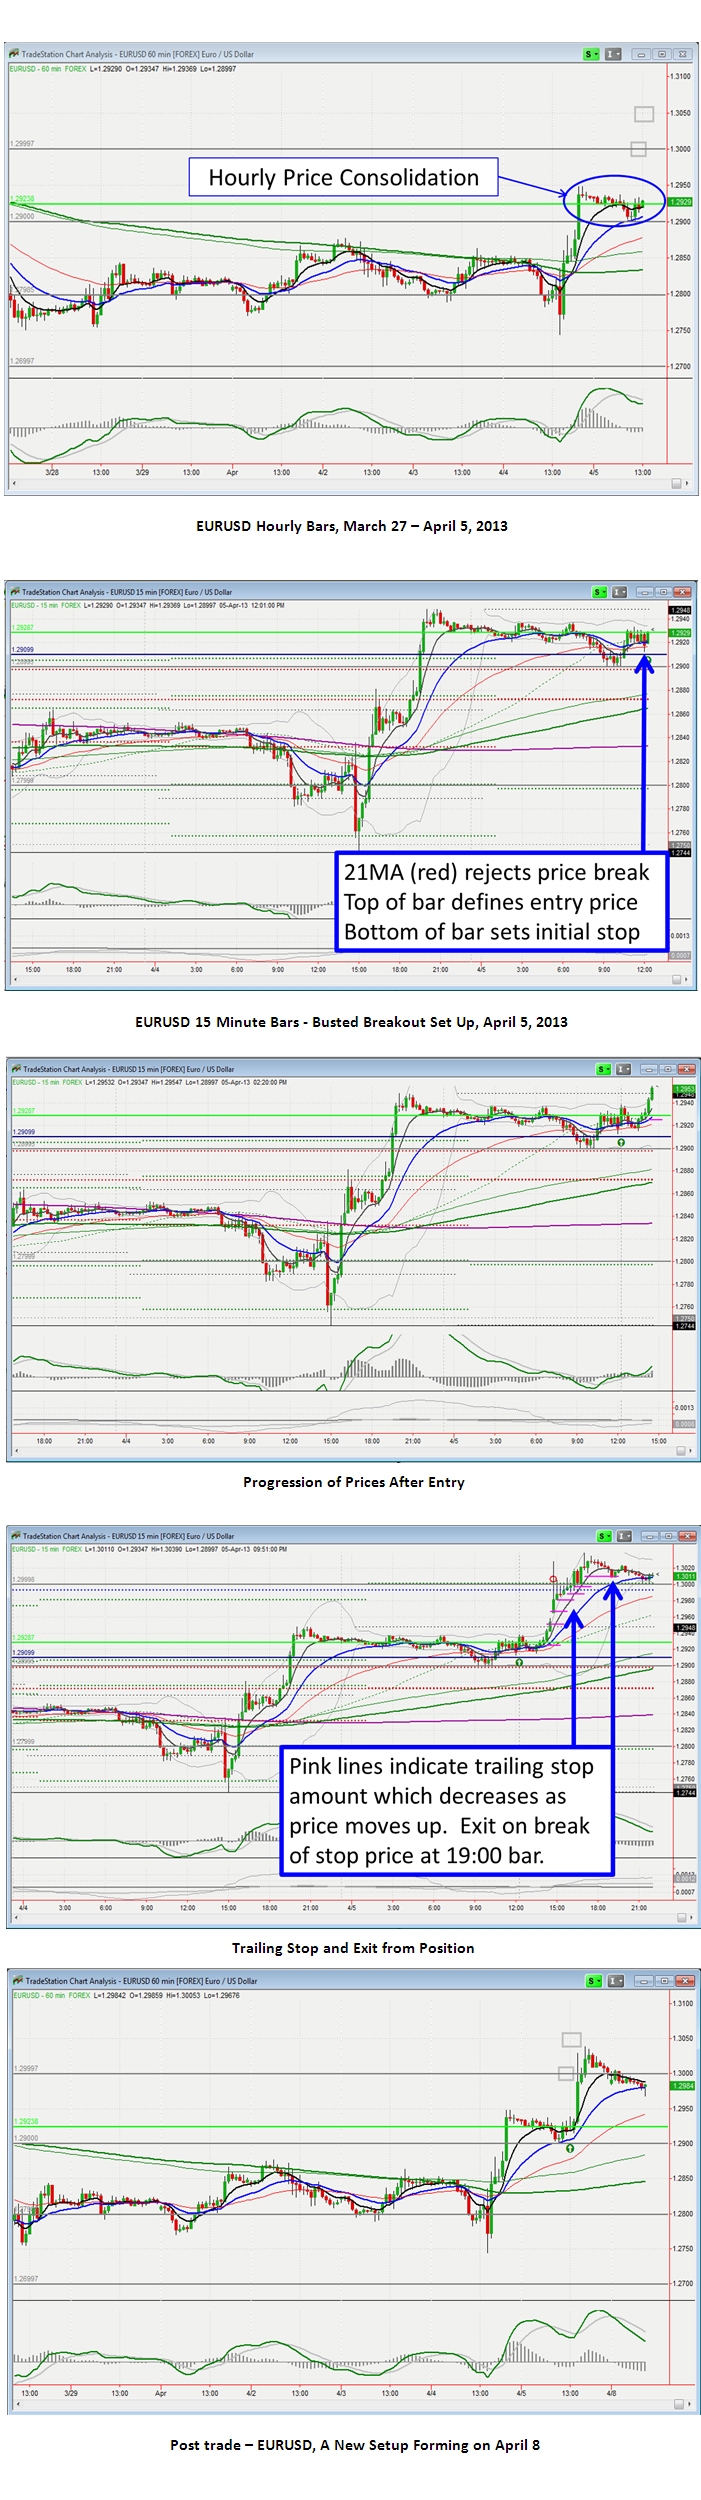
A number of rules must apply for a valid entry on both the higher timeframe chart (60 minutes) and entry chart (15 minutes). Two important consolidation setup conditions are visible on the entry chart below. First, there's a clear horizontal line through a number of bars (1.2927 in this case). Second, our break-out trader friends made a trial push lower just prior to 9:00. The breakout lower, however, failed.
At this point, I started stalking the busted pattern, waiting for a definite break above the horizontal line within a certain time limit. The red candle second to last on the chart below was a nice rejection candle (testing the 21MA from above) that, although not necessary, added value to the setup. This indicated that the EUR-bulls were taking over the command of the price. The entry trigger would be the break of the high of this candle with a tight stop set at the last low (see navy blue line below the same candle). Taking into account the conservative target of 1.3000 the reward-to-risk ratio of this trade was more than 3.5 (well above my required 2:1) and I was ready for the entry.
See chart larger
One note of caution: an important news announcement (NFP) was about to happen at 14:40 (8:30am US EST) that would likely have an impact on the EURUSD. Generally, I try to avoid trading around major news announcements, except when I am in a trade and my current stop would get me out at break even or better. Here at the entry, we were still 2 ½ hours away from this news release which left enough time (10 more bars) to make the trade at least break-even; otherwise I would exit the position before the announcement.
Trade Management
After the entry at the 12:15 bar price break up, the Busted pattern continued to develop as expected. Price tested support at the 21MA a second time before it started off with a nice momentum move (last 4 green bull candles in the chart below). This re-break of the horizontal line from below would have been an entry if the 1st one was not taken. The stop was at a good and protected place, and we saw higher highs & higher lows forming.
Look at the momentum move and think about why it happened— the market is actually running the stops of those short traders that were hoping for a successful break-down. They have to cover their shorts at prior highs which then drive prices higher towards our target. At this point, my position sizing rules required that I take off part of the position and move my stop to breakeven on the position. Now, I could relax and be grateful for a potential unexpected upside reward.
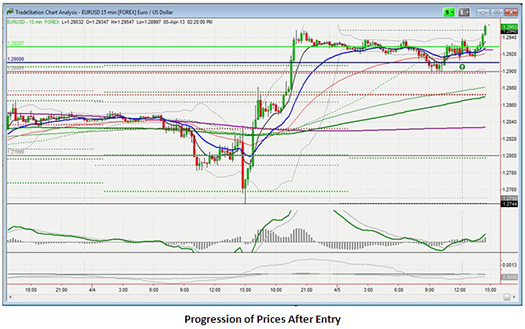
See chart larger
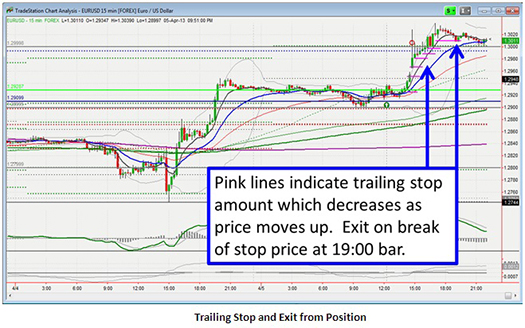
By the time the news release happened at 14:40, my stops protected me from a loss and the announcement actually had a bullish impact, helping the trade reach the 1st conservative target quickly (see thick grey line on the chart below). I took off another part of my position at the +3R point and left a trailing stop on the remainder—see small pink lines.
Once the position gained +4R, I tightened my trailing stop by a certain percentage to preserve more of my profits. The first pullback below the 8MA led to a stop-out of the full position at 1.3011. Overall, the conservative target had been well achieved and the trade got stopped out just short of the second target. The trade generated a net positive result of +3.1R (+0.2R, + 0.8R, and + 2.1R) with limited risk exposure throughout the trade.
See chart larger Post Trade – A New Setup Forming
After that trade, the EURUSD price moved back to the MAs on the 60min chart and things got interesting again. A nice, green rejection candle squeezed within the 8/21MA is about to trigger the next potential trade using another system whose trades last a little longer because it uses hourly bars only. I teach this system in the Forex workshop.
See chart larger.
As you might have noted with the trade example and the setup example above, these “Forex” trading systems may look familiar. One of my beliefs is that: “a chart is a chart,” and as such, the same system logic can apply for all timeframes, Forex pairs, and instruments beyond Forex.
Should you have any comments, remarks or questions I would be happy to answer them. gabriel "at" vantharp.com Good trading,
Gabriel Grammatidis
About the Author: Gabriel Grammatidis is a successful full-time trader and graduate of the Super Trader program. He has extensive experience trading Forex and will share his knowledge at a three-day Forex workshop being held May 21-23, 2013 at the Van Tharp Institute in Cary, North Carolina. He will also teach this workshop in Berlin, September 14-16. Gabriel can be reached at gabriel "at" vantharp.com.
Disclaimer
Trading Education
Why Don't You Trade Forex?
- "I’m too small to trade against the mega banks & hedge funds"
- "It’s a 24 hour market - I have to work and sleep some time!"
- "I can’t keep up with all the macro economic trends for the economies of the world."
- "I don’t even know half the currencies out there, how could I trade them?"
Here Are the Realities:
- The currencies market is the most liquid market in the world.
- It’s easily accessible and tradable by individuals today.
- Forex does not require huge amounts of capital to trade.
- The technical aspects of trading Forex are much more similar to trading equities or futures than they are different.
Don’t believe that last point? Take this test and see for yourself.
May 17-19 |
Swing Trading with Ken Long
|
May 21-23 |
Forex Trading with Gabriel Grammatidis
|
June 20-22 |
Peak Performance 101
We expect this workshop to sell out. |
July 13-14 |
Core Trading Systems
Longer Term Trading Systems from Ken Long
|
To see the schedule, including dates, prices, combo discounts and location, click here.
It is confirmed! Van will bring three VTI Workshops to Berlin this Fall Including Forex Systems with Gabriel.
| Berlin, Germany Workshops |
September 6-8 |
How to Develop a Winning Trading System
with Van Tharp and RJ Hixson
|
September 10-12 |
Blueprint for Trading Success
with Van Tharp and RJ Hixson
|
September 14-16 |
Forex Trading
with Gabriel Grammatidis
|
Register for all 3 and save $800!
Trading Tip
Google's Monster Earnings Moves
by D.R. Barton, Jr.
View On-line
Most stocks are likely to move after earnings reports. Google is no exception, and tends to make huge moves after its earnings are reported. In today’s article, we’re going to dig deep into the data and we will see that this is not just an “every once in a while occurrence” — Google is an earnings movement monster. Since Google reports its earnings after the close on Thursday (4/18), I thought it would be interesting to look at Google’s volatile earnings history and put some numbers to the hunches.
Google has grown in an almost unprecedented fashion. Its Initial Public Offering date was a little over eight years ago. Despite its tender age, it is one of the five biggest U.S. companies by market cap. Since it is so young, your hard-working scribe decided to go back and look at each earnings announcement and see if Google really is as volatile as I remembered. 34 earnings reports later, here’s what I found…
What a Short Strange Trip It’s Been (my apologies to the Grateful Dead)
Back in the late 1990’s, Cisco had a reputation for always hitting its earnings estimate, plus a penny. It was so consistent, that when they finally missed during the collapse of the internet bubble, the stock was ravaged.
Google has never had a reputation for consistency. Actually, it’s quite the opposite. Out of 34 reports, the stock has risen 18 times and dropped 16, basically a 50/50 proposition. That’s one reason the stock has reacted so violently to earnings reports. Any one instance is crap-shoot!
I think that another, deeper-seated reason is that the world still doesn’t understand Google’s business model and it doesn’t believe that Google can continue to make s-o-o-o-o much money selling internet ads. Adweek magazine reports that, of Google’s $50.2 billion in 2012 revenue, 95% of it came from advertising. Google has its thumbs in lots of pies, but internet ads are still the cash cow. The disbelief that Google’s business model can continue means that every time it misses its earnings estimates, investors think that the end is finally here. On the other hand, every time Google beats its earnings estimates, everyone is surprised that the game continues.
Let’s Get to Those Numbers
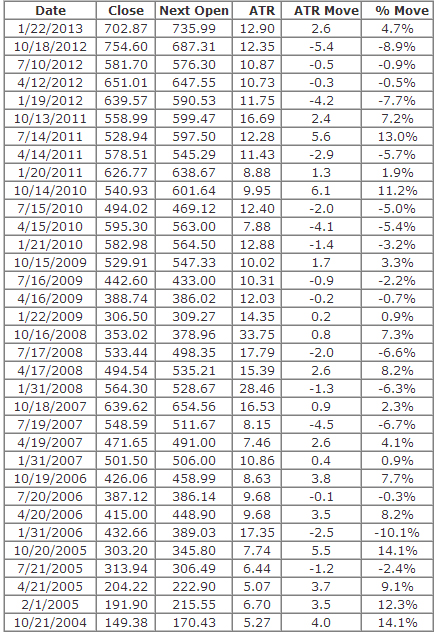
So what has happened to Google’s stock price in relation to its earnings announcements over its brief history? Google always reports after the markets close on a Thursday. (The lone exception occurred after an earnings leak during the morning of a reporting day last October. In the data below, I used the move after the leak as a surrogate for the traditional overnight move.) So, my main focus was what happened to the price between the close before they reported, to the open the morning after the report was released. After hours of grueling digging, just for you dear readers, here’s what I found (ATR = 14 day Average True Range):
Google Earnings Data, 2004 - Present
We could mine this data for hours, but here’s what I found to be the most interesting:
- Google’s price reaction to earnings is very volatile. Only in 6 out of 34 instances did the price move less than 1% as a result of an earnings announcement.
- More volatility stats: half of the earnings reports (17/34) resulted in price moves of 6% or more (in either direction)!
- Not surprisingly, the average absolute move (i.e., regardless of direction) was 6% and the standard deviation was 4%.
- Price made an average absolute move of 2.5 average true ranges (with a standard deviation of 1.7) after an earnings announcement. That is a huge average move!
Because that wasn’t fun enough, I also looked at next day follow through to see if Google’s price moves in the same direction as the overnight gap after the open. I believe the results are quite tradable.
For its first 13 reporting periods, Google’s stock largely returned toward the mean after an earnings report. On 10 out of 13 occasions, the stock traded in the opposite direction of the overnight move once trading began. To say it another way, if the stock gapped up after earnings, it would drop during the trading day after the gap (or vice versa for a gap down opening).
However, since the January 2008 earnings report, the opposite has happened. Google has predominantly traded in the direction of the gap. Out of the last 21 earnings reports, if Google gapped in one direction, it kept going in that direction 17 times or at an 81% rate of follow through. While this data may not reach the level of statistical significance, it still has a tradable edge. In addition, the average move from the open to the close the day after Google reports is 2.0%—which is plenty of movement for an intraday trade.
I hope you found this data useful. As always, I’d love to hear your comments and feedback! Please send them to drbarton “at” vantharp.com
Great Trading,
D. R.
About the Author: A passion for the systematic approach to the markets and lifelong love of teaching and learning have propelled D.R. Barton, Jr. to the top of the investment and trading arena. He is a regularly featured guest on both Report on Business TV, and WTOP News Radio in Washington, D.C., and has been a guest on Bloomberg Radio. His articles have appeared on SmartMoney.com and Financial Advisor magazine. You may contact D.R. at "drbarton" at "vantharp.com".
Disclaimer
Ken's Class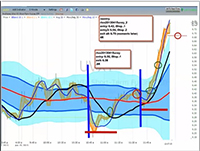
Ken goes fishing in the markets every day and sometimes, through preparation and attention, he lands a whale in his boat. On Monday, April 15, he had a series of good trades in the morning and continuing to attend to his craft, found himself in the right spot at the right time for an outsized trade result (+19R). In this ten minute video, Ken explains some regression line crossover system mechanics and then details his trades for the day including how he landed the whale for a +25R day.
Click Here to Watch the Video
News from Van
Updates to the Super Trader Program
The Super Trader Program will have a new pricing structure, beginning this July. For more information, click here.
 You Can Now Buy Van's New Book, Trading Beyond the Matrix Directly from VTI You Can Now Buy Van's New Book, Trading Beyond the Matrix Directly from VTI
Do You Have a Matrix Story? Since the release of Van's new book, Trading Beyond the Matrix, we have been hearing amazing stories about how the book is changing people's lives. We want to add a new section to the newsletter featuring these stories. If you have a story you would like to share, please email us at [email protected].
For more information, click here.
To purchase Trading Beyond the Matrix for $29.95, click here.
Podcasts and Interviews Featuring Dr. Van Tharp
Lately, Van has been talking about his new book, Trading Beyond the Matrix on various radio shows and podcasts. We have archived these and past interviews here so that you can listen!
Ask Van...
Everything we do here at the Van Tharp Institute is focused on helping you improve as a trader and investor. Consequently, we love to get your feedback, both positive and negative!
Click here to take our quick, 6-question survey.
Also, send comments or ask Van a question by clicking here.
Back to Top
Contact Us
Email us at [email protected]
The Van Tharp Institute does not support spamming in any way, shape or form. This is a subscription based newsletter.
To change your e-mail Address, e-mail us at [email protected].
To stop your subscription, click on the "unsubscribe" link at the bottom left-hand corner of this email.
How are we doing? Give us your feedback! Click here to take our quick survey.
800-385-4486 * 919-466-0043 * Fax 919-466-0408
SQN® and the System Quality Number® are registered trademarks of the Van Tharp Institute
Be sure to check us out on Facebook and Twitter!
 
Back to Top |


