Tharp's Thoughts Weekly Newsletter (View On-Line)
-
Article Market Condition: Bull Quiet, by Van K. Tharp, Ph.D.
-
-
-
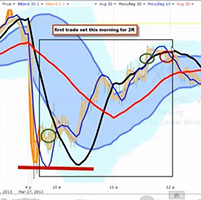
Ken's Class Ken Long explains a volatility trade using an inverse volatility ETF
Profitable Trading Systems That Will Fit Your Style –
3 Workshops Coming Up
Do you want to trade more often than monthly in your retirement plan but don’t have time to watch the markets all day? The Swing Trading workshop taught by Ken Long might be a good fit for you.
Are you interested in the currency markets but don't know where to start? In Gabriel Grammatidis' Forex workshop, you will go home with hands-on experience trading his proven intraday/swing Forex systems.
Is your biggest challenge a lack of time to manage your funds? Learn how as little as 15 minutes per week can generate returns that outperform the market consistently at Core Trading Systems with Ken Long.
For more information and a complete list of our workshops, click here.

Market Update for Period Ending March 28, 2013
Market Condition: Bull Quiet
by Van K. Tharp, Ph.D.
View On-line
I always say that people do not trade the markets; they trade their beliefs about the markets. Consequently, I'd like to point out that these updates reflect my beliefs. I find the market update information useful for my trading, so I do the work each month and am happy to share that information with my readers.
If, however, your beliefs are not similar to mine, then this information may not be useful to you. If you are inclined to perform some sort of intellectual exercise to prove one of my beliefs wrong, simply remember that everyone can usually find lots of evidence to support their beliefs and refute others. Know that I acknowledge that these are my beliefs and that your beliefs may be different.
These updates are in the first issue of Tharp's Thoughts each month. This allows us to get the closing month's data. These updates cover 1) the market type (first mentioned in the April 30, 2008 edition of Tharp's Thoughts and readable on our web site), 2) the five-week status on each of the major U.S. stock market indices, 3) our four star inflation-deflation model plus John Williams' statistics, and 4) the movement of the dollar. I now report on the strongest and weakest areas of the overall market in a separate SQN® Report. I may come out with that report twice a month if there are significant market changes.—Van K. Tharp
Part I: Commentary—The Big Picture
I’ve been reading a great book that I highly recommend, but only if you are interested in the money game. It’s called, The History of Money by Jack Weatherford. It talks about how the success of the great, Greek civilization was really due to Croesus of Lydia inventing coins that had real value. Weatherford describes the power of the Romans’ money system and how the governmental abuse of that system resulted in the empire’s downfall. The same story held true for the British Empire. And because our story hasn’t ended yet, we can probably say the same thing will happen to the American Empire. In fact, my guess is that Richard Nixon will go down as the worst president ever, and not because of Watergate.
Nixon’s Secretary of the Treasury was John Connally, a man who later in life, couldn’t manage his own financial affairs and eventually went bankrupt. Connally and Nixon together came up with wage and price controls and all sorts of interesting measures for a broad economic program. An early, unknown part of the package they were planning was to formerly take the US off of the gold standard. After this package went into effect, every currency in the world was allowed to float, and more importantly, the US could continue to get involved with costly wars and continue huge government spending. This could happen because the dollar was only attached to the faith people had it in. What has that faith allowed the US to do? Today, we have $16.7 trillion in official debt and over $100 trillion in unofficial debt, all because the government can just ask the Federal Reserve to print money whenever it needs some. That is the huge fundamental condition that lies behind today’s secular bear market.
On March 31st, The New York Times reported that trading volume has increasingly migrated from established bourses like the New York Stock Exchange to hidden places — private platforms, including dark pools. According to the Times, the shift helps big traders hide what they are doing in the markets, and the movement is getting stronger. In 2008, off-market trading amounted to about 16 percent of the total daily share volume, but it’s now hitting about 40 percent. I’m not sure what that means, but it’s something every trader should know about.
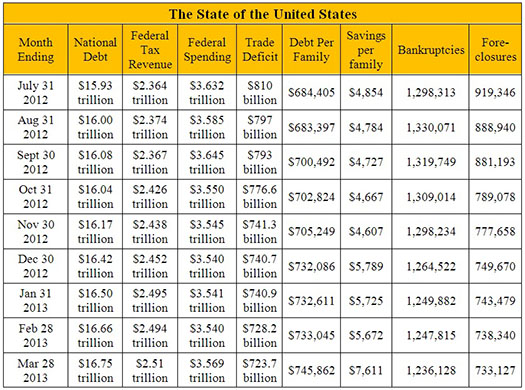
The U.S. National Debt clock (www.usdebtclock.org) reports real-time on a number of national fiscal figures. According to the debt clock, our national debt stands at $16.75 trillion — that’s up $90 billion in the last month.
The US population remains at 315 million with a workforce bump last month of 100,000 which is now at 143.6 million. The Boomer retirement wave continued - another 100,000 people joined retiree and social security recipient status this month; that number is now up to 62.5 million people. Food stamp recipients dropped a half million to 47.8 million.
Here’s the update for some figures from the debt clock website so you can watch the changes over time. A few of the figures actually go down in some months and may not make total sense on a monthly basis though those variations tend to be small.
Part II: The Current Stock Market Type Is Bull Quiet
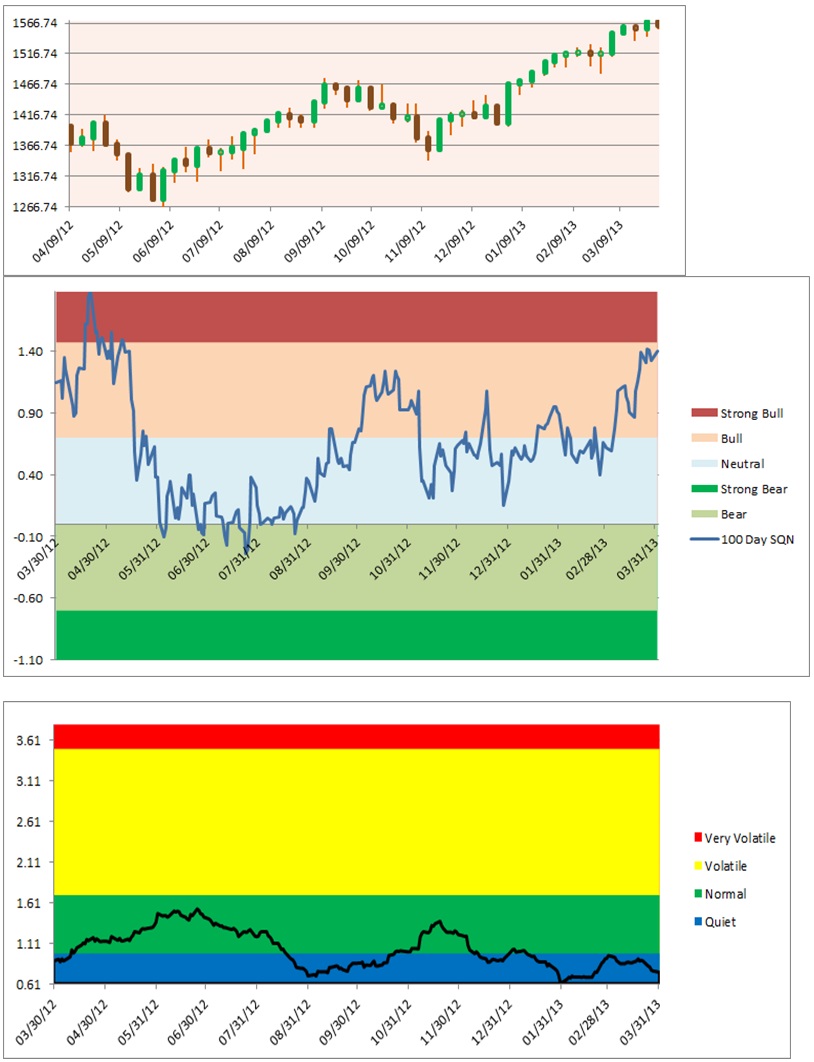
Each month, I look at the market SQN® score for the daily percent changes in the S&P 500 Index over 200, 100, 50 and 25 days. For our purposes, the S&P 500 Index defines the market. The market SQN score helps me understand the market’s trend. So let’s look at the weekly S&P 500 chart first to help us understand the SQN scores:
To see the 3 following charts stacked and aligned, click here.
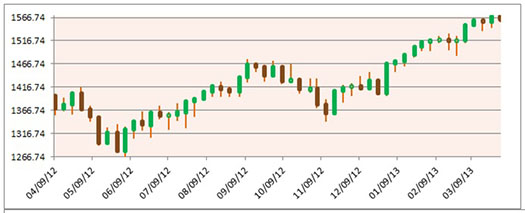
The market has been in a nice uptrend since November 2012 and except for a small correction last September—October, it has generally been going up for the last nine months. This translates to, 1) a strong bull market for the 200 day SQN, and 2) a bull market for the 100, 50, and 25 day SQNs. However, both the 100 and the 50 are very close to strong bull.
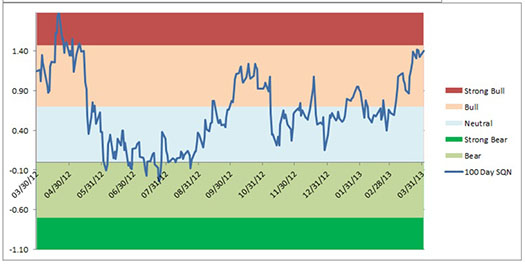
The next chart shows the 100 day SQN score as bullish:
The next graph shows that volatility still remains well in the quiet zone. This is generally very good for the market, as bear markets seem to need volatile conditions.
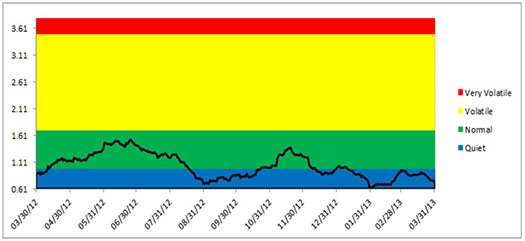
To see the three previous charts stacked and aligned, click here.
The next table shows the activity of the three major U.S. indices at the closing Friday of each week:
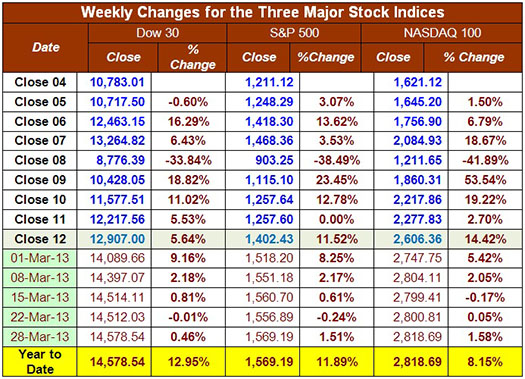
All three indices show solid gains for the year. The S&P 500 is hitting new highs and both the DOW and the S&P 500 are showing double digit gains over just a three-month period.
Part III: Our Four Star Inflation-Deflation Model
In the simplest terms, inflation means that stuff gets more expensive, and deflation means that stuff gets cheaper. There’s a correlation between the inflation rate and market levels, so the inflation rate can help traders understand big-picture processes. Here is my four star inflation-deflation model for the last few years:
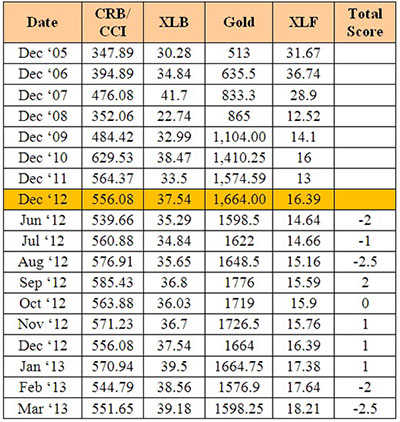
Looking back over the most recent two-month and six-month periods provides the current month's score, given in the table below.
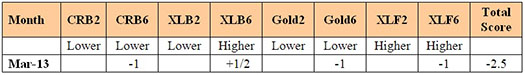
Last month, the model flipped the results from the inflationary scores of the three previous months, to a deflationary score; this month, it has moved in that direction even more.
Commodities and gold were lower on April 1 than they were at the end of December and the end of August. This “stuff” has become cheaper, so it signals deflation. XLF is also signaling deflation, though it is up over the two month and six month periods. XLF does better in deflationary conditions than in inflationary conditions. That’s why it’s a -1.
XLB is again the lone model component flashing inflation this month, but even this one moved down over the last two months so it’s currently a weak signal of inflation and only earned +1/2.
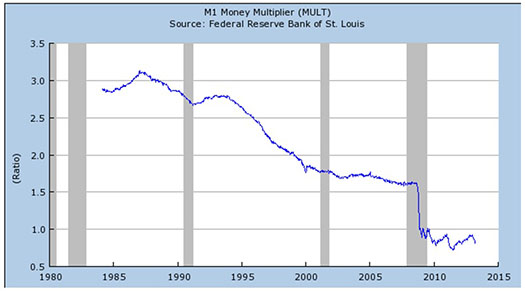
The money multiplier is still having a deflationary effect on the economy. Banks are not lending or borrowers are not borrowing or both are happening. Until the ratio gets back over 1, the Fed’s intense efforts to increase the money supply are being dampened by the low money multiplier ratio.
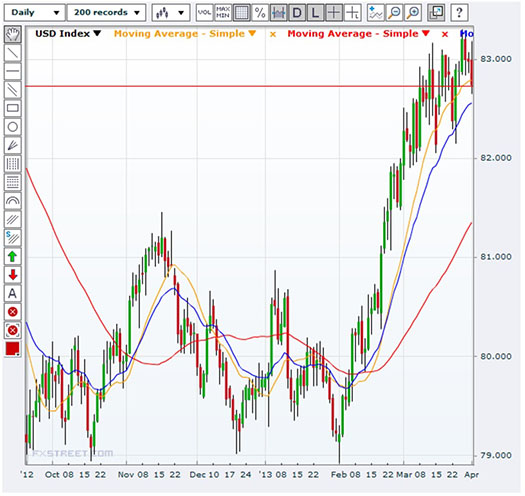
Part IV: Tracking the Dollar
Okay, so the dollar was going up while I traveled. However, it wasn’t going up in Australia. In fact, it dropped about 2-3 cents versus the Aussie dollar while I was there. But for most countries, the dollar has remained strong.
General Comments
Most of you should be fully invested at this point but with stops in place. As long as the market continues to be nicely bullish, you should be long. However, you should only be long stocks that are going up, not stocks like AAPL. When the markets start to get more volatile (i.e., the VIX index or VXX ETF goes up consistently), then I’d become concerned and begin to shift to sideways strategies. Right now, everything is still a “go” but remember, we remain in a secular bear market with horrible fundamentals.
On an interesting side note, I was stopped out of almost everything long position I had over the last two days — April 2nd and 3rd. When that happens, it’s sometimes a warning that things are about to change.
For the foreseeable future, the Fed will keep interest at an effective rate of zero and continue its efforts to drive money into the economy — which shows up in equities. In search of yield, capital has little elsewhere to go for now.
Until next month, this is Van Tharp.
These monthly market updates are not intended for predictive purposes; rather, they’re intended to help traders decide which of their trading systems should work best in the current market conditions. In bear markets—which are almost always volatile by nature—shorter-term strategies, and those that allow going short, tend to work better than long-only or intermediate/longer-term systems.
Which of your trading systems fit this current market type? Of course, this question implies that you have multiple trading systems and that you know how they perform under various market conditions. If you haven't heard of this concept or the other concepts mentioned above, read my book, Super Trader, which covers these areas and more, so that you can make money in any kind of market condition.
Crisis always implies opportunity. Those with good trading skills can make money in this market—a lot of money. There were lots of good opportunities in 2012, and many more to come in 2013. Did you make money? If not, then do you understand why not? The refinement of good trading skills doesn't just happen by opening an account and adding money. You probably spent years learning how to perform your current job at a high skill level. Do you expect to perform at the same high level in your trading without similar preparation? Financial market trading is an arena filled with world-class competition. Additionally, and most importantly, trading requires massive self-work to produce consistent, large profits under multiple market conditions. Prepare yourself to succeed with a deep desire, strong commitment and the right training.
About the Author: Trading coach and author Van K. Tharp, Ph.D. is widely recognized for his best-selling books and outstanding Peak Performance Home Study Program—a highly regarded classic that is suitable for all levels of traders and investors. You can learn more about Van Tharp at www.vantharp.com. His new book, Trading Beyond The Matrix, is available now at matrix.vantharp.com.
Trading Education
Workshops
Be sure to take action and register for any workshop you are interested in attending. We have several that are sold out with a waiting list.
April 6-7 |
Oneness Awakening Workshop |
April 19-21
April 22-24 |
Day Trading Workshop with Ken Long — SOLD OUT
Live Day Trading Sessions with Ken Long |
May 17-19 |
Swing Trading with Ken Long
|
May 21-23 |
Forex Trading with Gabriel Grammatidis
|
June 20-22 |
Peak Performance 101
We expect this workshop to sell out as well, register soon to reserve your seat. |
June 24-27 |
Peak Performance 202 — SOLD OUT
|
Jun 29-Jul 1 |
Peak Performance 203 — SOLD OUT
|
July 13-14 |
Core Trading Systems
Longer Term Trading Systems
|
To see the schedule, including dates, prices, combo discounts and location, click here.
This month, we expect to make a decision on whether or not Van will be teaching in Berlin, Germany in September. Once we know, we can set the workshop schedule for August-November 2013.
We always have our Super Trader Summit in December.
Back to Top
Trading Tip
March 2013 SQN® Report
by Van K. Tharp, Ph.D.
View On-line
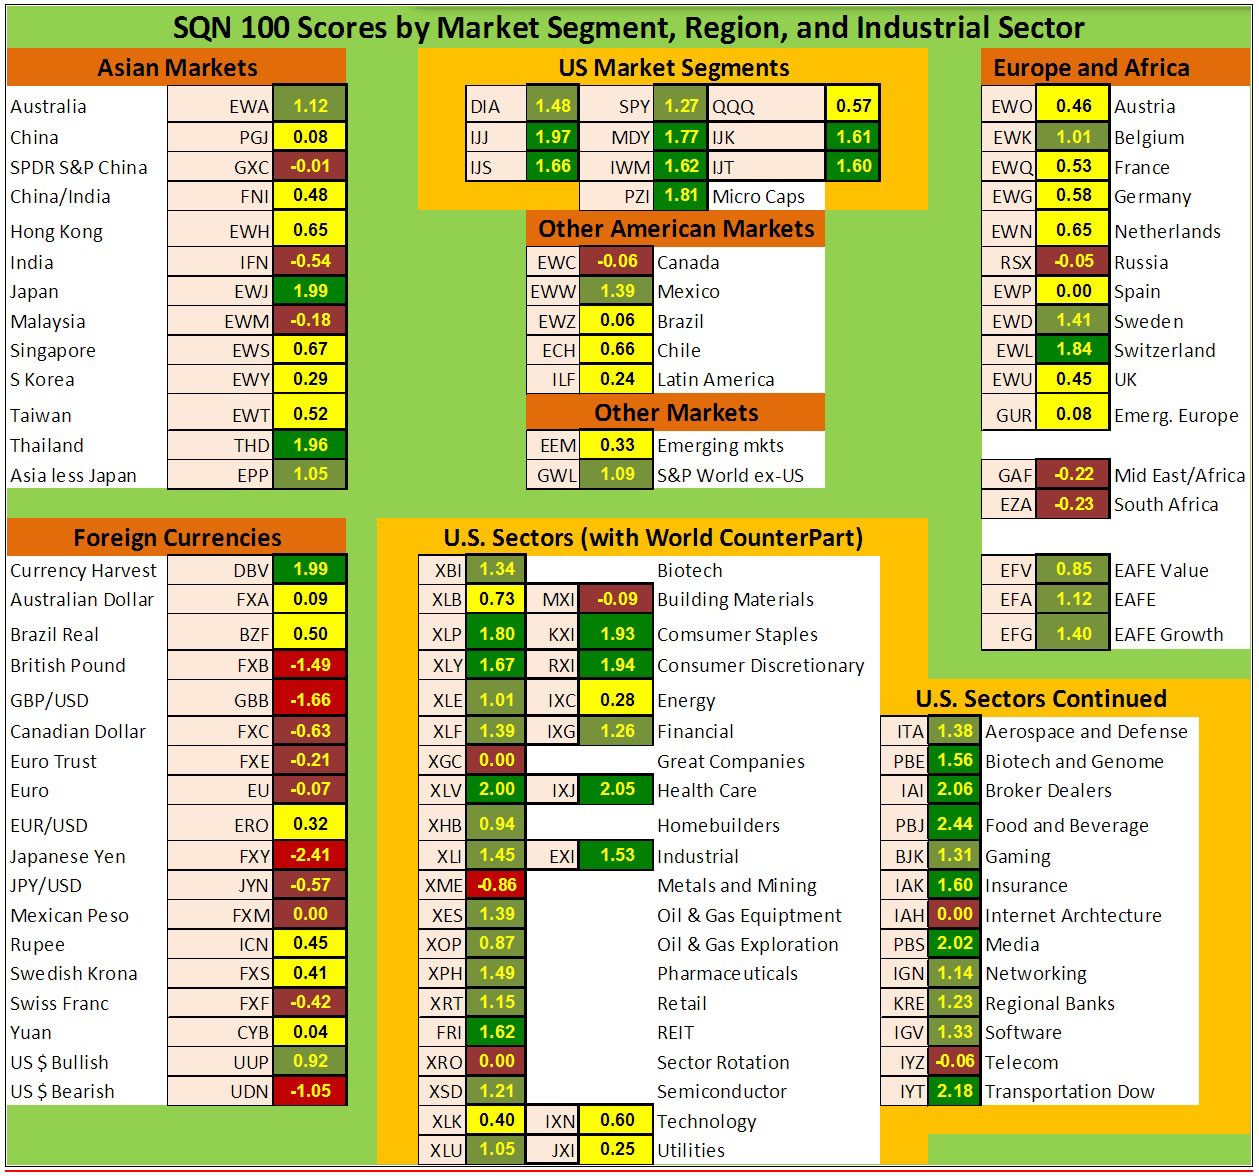
There are numerous ETFs that now track everything from countries, commodities, currencies and stock market indices to individual market sectors. ETFs provide a wonderfully easy way to discover what’s happening in the world markets. Consequently, I now use the System Quality Number® (SQN®) score for 100 days to measure the relative performance of numerous markets in a world model.
The SQN 100 score uses the daily percent change for a 100-day period. Typically, an SQN score over 1.45 is strongly bullish and a score below -0.7 is very weak. We use the following color codes to help communicate the strengths and weaknesses of the ETFs:
- Green: ETFs with very strong SQN scores (0.75 to 1.5).
- Yellow: ETFs with slightly positive SQN scores (0 to 0.75).
- Brown: ETFs with slightly negative SQN scores (0 to -0.7).
- Red: Very weak ETFs that earn negative SQN scores (< -0.7).
The world market model spreadsheet report below contains most currently available ETFs; including inverse funds, but excluding leveraged funds. In short, it covers the geographic world, the major asset classes, the equity market segments, the industrial sectors and the major currencies.
World Market Summary
The US equities markets are green in all sectors aside from large cap growth, and that’s probably because of AAPL. The rest of the world isn’t nearly as strong, showing some green, but mostly yellow and brown. Switzerland, Japan and Thailand are all very strong. Australia, Belgium and Sweden are strong as well. The rest are fairly neutral.
Weak countries include India, Malaysia, Canada, Russia and Africa (especially South Africa).
Most of the industrial sectors, especially in the US, are also strong. Only XLB (building) and XLK (technology) are yellow. Metals and Mining, Internet Architecture and Telecom are the weakest areas. I still keep XGC on the chart (great companies) just to show you how subjective someone’s opinion was of what is “great.” Great is usually temporary. In fact, I now have a wall chart of the Dow Jones Industrials all the way back to its origin. It’s pretty amazing when you think that none of the original DOW 30 are still around except GE, and that went off the index and then back on.
Currencies are all particularly weak, with the U.S. Dollar as the lone exception. The British pound and Japanese Yen are both very weak.
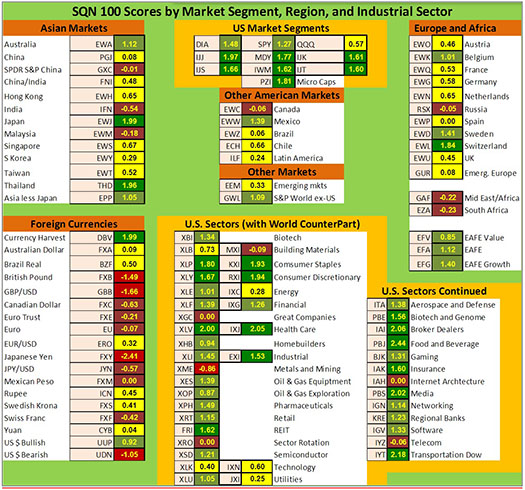
(Click here for a larger view of this chart)
The next chart shows real estate, debt instruments, commodities and the top and bottom ETFs for the past 100 days.
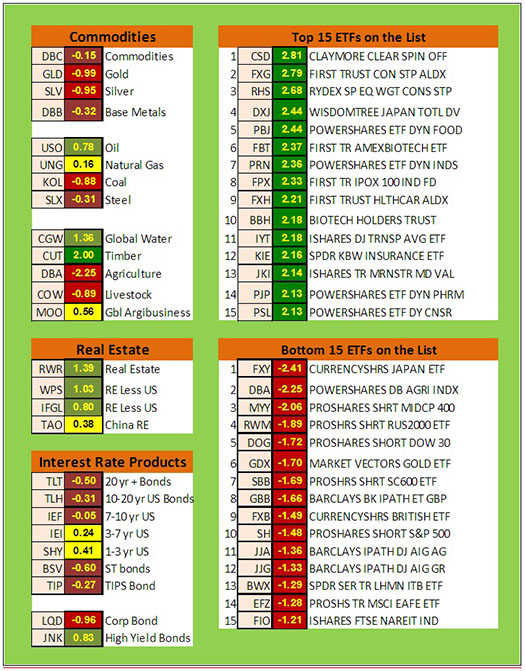
Commodities are weak with five of 13 areas being red and three more being brown. Gold, silver, coal and agriculture are all very weak. Commodities, base metals and steel are slightly negative. Timber is very strong and global water and oil are also doing well.
The category of debt based ETFs is weak overall. Corporate bonds are now very negative but the high yield ETF, JNK, remains strong and is the only green left in the category. Shorter term US Treasuries are at least positive but except for JNK, the other debt ETFs have negative SQN scores.
Real Estate, as a category, is light green, except for China.
Of the strongest ETFs in the database, the top 15 all have SQN scores over 2.0 while the bottom three ETFs in the database have SQNs less than -2, which is very, very weak.
The strongest ETF in the database only invests in potential spin-off companies. The next two, FXG and RHS, invest in consumer staples. Finally, I was shocked to see number 4, because I had a position in for a while last year and it just entered into the picture unexpectedly.
The weakest ETFs have to do with the Yen, agriculture, gold and some short funds. Shorting is not a viable strategy right now unless it is in something like VXX or perhaps AAPL.
What's Going On?
Overall, if you are fully invested in US equities markets, you should have done very well in the first three months of the year. US stocks have been the place to be and it doesn’t hurt that the dollar has recently been the strongest currency. Everything could change in a month or so, but for now, the US market looks strong.
We seem to be in a deflationary scenario. Gold, for a while, is not the place to be. The stock market, on the other hand, is quiet bull. Need I say more?
The markets always offer opportunities, but to capture those opportunities, you MUST know what you are doing. If you want to trade these markets, you need to approach them as a trader, not a long-term investor. We’d like to help you learn how to trade professionally, trying to navigate these markets without an education is hazardous to your wealth.
All the beliefs given in this update are my own. Though I find them useful, you may not. You can only trade your beliefs about the markets.
 Ken's Class Ken's Class
In this six minute video, Ken explains a volatility trade using an inverse volatility ETF. In the morning of March 27, Ken entered XIV long on declining volatility and a regression line crossover. He closed it towards lunchtime for a +2R trade. The morning price behavior also indicated the likelihood for another trade and he explains what he saw that prompted him to go long again mid afternoon.
Click Here to Watch the Video
 Trading Beyond the Matrix: The Red Pill for Traders and Investors is Back in Stock! Trading Beyond the Matrix: The Red Pill for Traders and Investors is Back in Stock!
After being sold out in all online bookstores for the past few weeks, Trading Beyond the Matrix is back in stock! You can now purchase Van's newest book from any of these online retailers:
Amazon | Barnes & Noble | Wiley | IndieBound | Books-a-Million
For more information about Trading Beyond the Matrix, including special discounts and offers from The Van Tharp Institute when you purchase, click here.
Ask Van...
Everything we do here at the Van Tharp Institute is focused on helping you improve as a trader and investor. Consequently, we love to get your feedback, both positive and negative!
Click here to take our quick, 6-question survey.
Also, send comments or ask Van a question by clicking here.
Back to Top
Contact Us
Email us at [email protected]
The Van Tharp Institute does not support spamming in any way, shape or form. This is a subscription based newsletter.
To change your e-mail Address, e-mail us at [email protected].
To stop your subscription, click on the "unsubscribe" link at the bottom left-hand corner of this email.
How are we doing? Give us your feedback! Click here to take our quick survey.
800-385-4486 * 919-466-0043 * Fax 919-466-0408
SQN® and the System Quality Number® are registered trademarks of the Van Tharp Institute
Be sure to check us out on Facebook and Twitter!
 
Back to Top |


