Tharp's Thoughts Weekly Newsletter (View On-Line)
-
Article Market Condition: Neutral Quiet, by R.J. Hixson
-
-
-
Ken's Class Intraday Turbo Trade and a Weekend Report Sample by Ken Long

VTI is bringing you the best of our technical workshops!
Ken Long will be presenting his Day, Live-Day, Swing and Core Trading Systems workshops and Gabriel Grammatidis will be presenting his popular Forex workshop. All starting in April, continuing through July.
Register now to receive the $700 early enrollment discounts.
For more information and a complete list of our workshops, click here.
Market Update for Period Ending March 1, 2013
Market Condition: Neutral Quiet
by R.J. Hixson
View On-line
I always say that people do not trade the markets; they trade their beliefs about the markets. Consequently, I'd like to point out that these updates reflect my beliefs. I find the market update information useful for my trading, so I do the work each month and am happy to share that information with my readers.
If, however, your beliefs are not similar to mine, then this information may not be useful to you. If you are inclined to perform some sort of intellectual exercise to prove one of my beliefs wrong, simply remember that everyone can usually find lots of evidence to support their beliefs and refute others. Know that I acknowledge that these are my beliefs and that your beliefs may be different.
These updates are in the first issue of Tharp's Thoughts each month. This allows us to get the closing month's data. These updates cover 1) the market type (first mentioned in the April 30, 2008 edition of Tharp's Thoughts and readable on our web site), 2) the five-week status on each of the major U.S. stock market indices, 3) our four star inflation—deflation model plus John Williams' statistics, and 4) the movement of the dollar. I now report on the strongest and weakest areas of the overall market in a separate SQN® Report. I may come out with that report twice a month if there are significant market changes.
I am in Australia teaching workshops right now, so this month's update was prepared by RJ.—Van K. Tharp
Part I: Commentary—The Big Picture
The world did not end in 2012 at the end of the Mayan calendar nor did the US go over the fiscal cliff on December 31. Now, we appear to be surviving the highly threatening federal budget cuts caused by the sequestration “crisis” caused by budget “cuts”. Truly, these cuts merely reduce the growth rate of the budget and deficit rather than actually decreasing current expenditures. But don’t worry, if surviving the sequester seems like a denouement, realize it’s only an intermission between acts in the ongoing budget drama.
Care for some perspective on how difficult it’s going to be to pass true budgetary reform? Consider just three figures for a moment: the sequester total, the 2013 deficit, and the debt. The much railed against, just mandated cuts of $85B are like a drop in the $1,050B ($1T) deficit bucket this year, let alone the more than $100,000B ($100T) in funded and unfunded US liabilities.
As Van has pointed out repeatedly, no real decisions have been made regarding the significant deficit and debt situations. Congress and the Administration have yet to touch the two biggest components of the federal budget—Social Security and Medicare/Medicaid. These two items (really three) make up nearly half of the federal budget. After the sequestration cuts began, Obama signaled he may be open to putting fiscal reform in these areas and forms of transfer payments on the table. We’ll have to wait and see if that goes anywhere anytime soon.
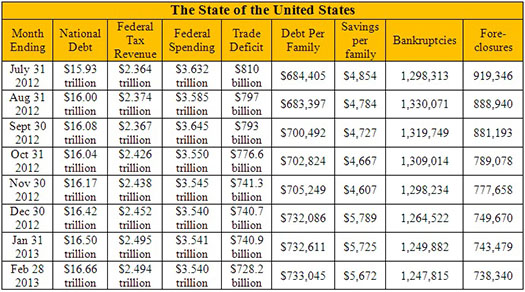
The U.S. National Debt clock (www.usdebtclock.org) reports real-time on a number of national fiscal figures. It’s almost surreal watching the numbers jump while you look at the website – though the figures represent the current fiscal phenomenon.
According to the debt clock, our national debt stands at $16.66 trillion—that’s up $120 billion in the last month. The website also added an interesting new item—sequester cuts already total about $15B. There’s another calculated field for the 2013 tax increases, which currently stands at $39B. That $39B provides a 6% contribution to the budget for this year. That might sound OK, until you remember that the deficit is running at $1,050B ($1T) for the fiscal year.
The US population remains at 315 million with a workforce bump last month of 200,000, up to 143.5 million. The Boomer retirement wave is in its earliest stages, as another 100,000 people have joined the ranks of the retirees and social security recipients this month; which is now up to a total of 62.4 million people. Food stamp recipients remain at 48.3 million. Additionally, there have been 1.2 million bankruptcies and 738,340 foreclosures so far this year.
Here’s the update for some figures from the debt clock website so you can watch the changes over time. As Van has mentioned, some of the figures vary from month-to-month and may not make total sense, however, these variations tend to be relatively small. Besides, when you get into the trillions, rounding to the nearest ten billion mark just makes sense.
Part II: The Current Stock Market Type Is Neutral Normal
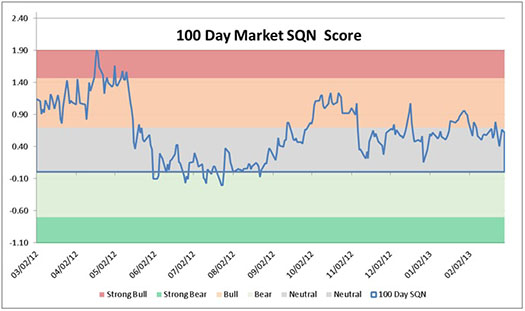
Each month, Van looks at the market SQN® score for the daily percent changes in the S&P 500 Index over 200, 100, 50 and 25 days. For our purposes, the S&P 500 Index defines the market. The market SQN score helps Van understand the market’s trend.
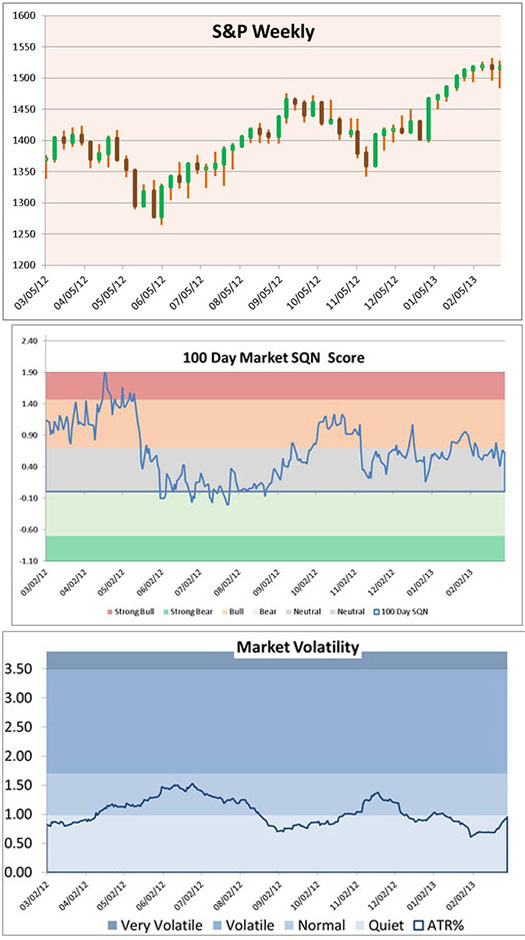
This month, it might be useful to look at the weekly S&P 500 chart first to help us understand the SQN scores.
To see the three following charts stacked and aligned, click here.
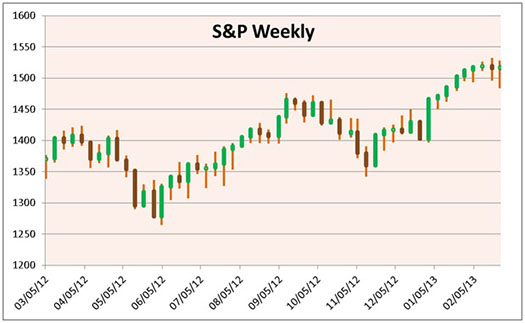
The market continued its recent rise for the first three weeks of February but then entered a volatile sideways phase for about the last eight trading days. The shortest term market SQN measurement Van uses is the 25-day period, which happens to be neutral for February. You can see the evidence of this on the chart: the end of month price is not much above the late January price and there are large wicks on the last two candles. Volatility + mild gain = lower SQN.
The intermediate term of 50 days has a market SQN in the bull range because that measure started in mid-December. The longest term measure, 200 days, began last May. That’s the start of the first distinct leg up of the current advance, and you can see why the 200 day market SQN is also in the bull range.
Van uses the 100-day period as his primary gauge for the market type directional component. Going back 100 days puts us around 10/5/2012. The 100 day SQN scores the market in neutral, and you can probably see why. While the market is higher today than it was in early October, that rise has been neither steady nor dramatic over the last five months.
The next graph shows that the volatility is still in the quiet zone, though it’s getting very close to the normal range now. Continued volatility for the next few weeks could easily cause volatility to move into the normal range in March.
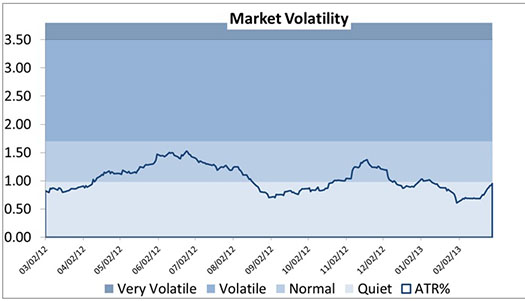
To see the three previous charts stacked and aligned, click here.
The next chart shows the activity of the three major U.S. indices at the closing Friday of each week recently.
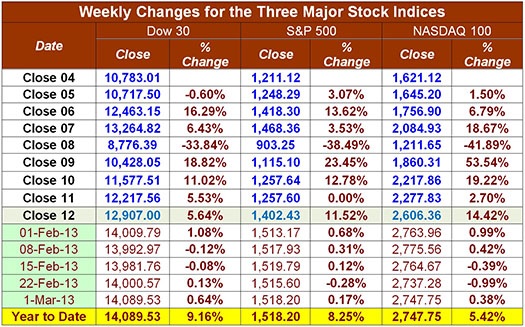
You can see some weakness showing up in February as the volatility slowed the market’s advance. Still, all three indices show solid single digit gains for the first two full months of the year.
Part III: Our Four Star Inflation-Deflation Model
In the simplest terms, inflation means that stuff gets more expensive, and deflation means that stuff gets cheaper. There’s a correlation between the inflation rate and market levels, so the inflation rate can help traders understand big-picture processes. Here is Van's four star inflation-deflation model for the last few years:
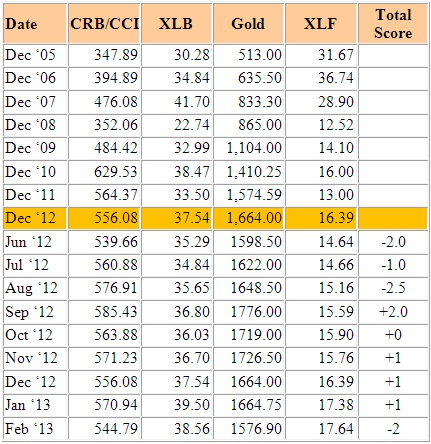
Looking back over the most recent two-month and six-month periods provides the current month's score, given in the table below.
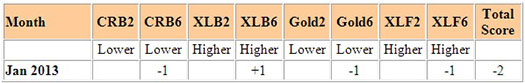
Last month, the model flipped the results from the inflationary scores of the three previous months, to a solidly deflationary score of -2.
Commodities and gold were lower on March 1 than they were at the end of December and the end of August. This “stuff” has become cheaper, so it signals deflation. XLF is also signaling deflation, though it is up over the two month and six month periods. XLF does better in deflationary conditions than in inflationary conditions. That’s why it’s a -1 for last month.
XLB is the lone model component flashing inflation this month, and it did so for both the two month and six month periods. Why might this be? US-based material processing companies make up the vast majority of the ETF and given equities’ performance over the last two and six months, it’s not surprising perhaps that the stock prices of companies comprising the ETF are up as well. Interestingly, Van has written about Martin Pring using the XLB:XLF ratio as an inflation/deflation index. Since mid-2011, that ratio has experienced a mild, though fairly steady decline.
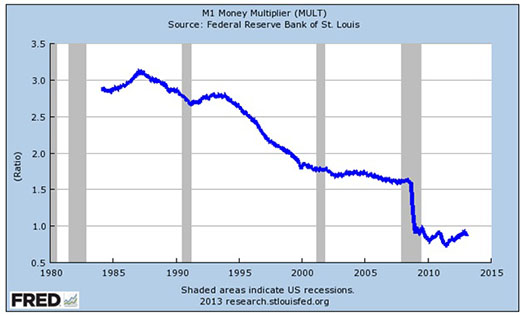
In spite of the Fed’s near doubling of the M1 money supply since 2008, its efforts to stoke inflation have had very limited success. Since about 2008, banks have been less willing to lend, while business and consumers have been less willing to borrow money. This shift towards a more conservative stance on debt shows up in the following chart of the money multiplier effect. A money multiplier below 1 is deflationary, as banks are not lending as anywhere near as much as they used to.
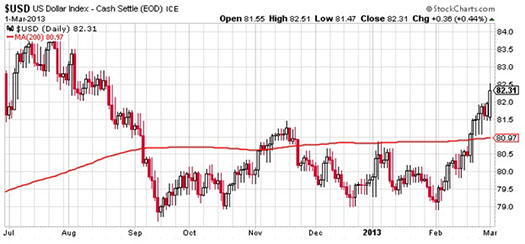
Part IV: Tracking the Dollar
Van left for Asia towards the end of February, so the continued strength of the US Dollar is likely only temporary. The Tharp Effect, whereby the dollar loses strength when Van travels internationally, still allows several weeks for the dollar to fall with Van not returning until later this month. Kidding aside, the dollar had an impressive rally during the month of February, taking it out of its recent range since last September.
General Comments
If the market were to continue down much more from here, we would likely see a continuing increase in volatility – bear markets don’t tend to start out in quiet volatility conditions. If volatility declines from here, we may see the market drift sideways or continue upward from here.
For the foreseeable future, the Fed will keep interest at an effective rate of zero and continue its efforts to drive money into the economy – which shows up in equities. In search of returns, capital has little elsewhere to go for now.
Given the market’s shoulder shrug to the sequestration, equities may not be a bad place – at least for traders who have shorter term systems developed for these conditions.
Van will be back next month for the March update.
These monthly market updates are not intended for predictive purposes; rather, they’re intended to help traders decide which of their trading systems should work best in the current market conditions. In bear markets—which are almost always volatile by nature—shorter-term strategies, and those that allow going short, tend to work better than long-only or intermediate/longer-term systems.
Which of your trading systems fit this current market type? Of course, this question implies that you have multiple trading systems and that you know how they perform under various market conditions. If you haven't heard of this concept or the other concepts mentioned above, read my book, Trading Beyond the Matrix, which covers these areas and more, so that you can make money in any kind of market condition.
Crisis always implies opportunity. Those with good trading skills can make money in this market—a lot of money. There were lots of good opportunities in 2012, and many more to come in 2013. Did you make money? If not, then do you understand why not? The refinement of good trading skills doesn't just happen by opening an account and adding money. You probably spent years learning how to perform your current job at a high skill level. Do you expect to perform at the same high level in your trading without similar preparation? Financial market trading is an arena filled with world-class competition. Additionally, and most importantly, trading requires massive self-work to produce consistent, large profits under multiple market conditions. Prepare yourself to succeed with a deep desire, strong commitment and the right training.
About the Author: R.J. Hixson is a devoted husband and active father. At the Van Tharp Institute, he researches and develops new products and services that help traders trade better. He recently started working part of each day at a treadmill walking desk. He can be contacted at “rj” at “vantharp.com”.
Trading Education
Workshops
Ken Long Has A New Day Trading Workshop in April!
March 15-17 |
Peak Performance 203—Australia
"The Happiness" Workshop
|
April 6-7 |
Oneness Awakening Workshop |
April 19-21 |
NEW Day Trading Workshop with Ken Long
Learn two day trading systems, the Frog and the brand new RLCO system. You'll be ready to trade them on your own when you leave this workshop!
|
April 22-24 |
Live Day Trading Sessions with Ken Long
Trade the Frog and RLCO side by side with Ken for three days of live trading.
|
May 17-19 |
Swing Trading with Ken Long
|
May 21-23 |
Forex Trading with Gabriel Grammatidis
|
June 20-22 |
Peak Performance 101 |
June 24-27 |
Peak Performance 202
|
Jun 29-Jul 1 |
Peak Performance 203
"The Happiness" Workshop
|
July 13-14 |
Core Trading Systems
Longer Term Trading Systems
|
To see the schedule, including dates, prices, combo discounts and location, click here.
Trading Tip
February 2013 SQN® Report
by R.J. Hixson
View On-line
There are numerous ETFs that now track everything from countries, commodities, currencies and stock market indices to individual market sectors. ETFs provide a wonderfully easy way to discover what’s happening in the world markets. Consequently, I now use the System Quality Number® (SQN®) score for 100 days to measure the relative performance of numerous markets in a world model.
The SQN 100 score uses the daily percent change for a 100-day period. Typically, an SQN score over 1.45 is strongly bullish and a score below -0.7 is very weak. We use the following color codes to help communicate the strengths and weaknesses of the ETFs:
- Green: ETFs with very strong SQN scores (0.75 to 1.5).
- Yellow: ETFs with slightly positive SQN scores (0 to 0.75).
- Brown: ETFs with slightly negative SQN scores (0 to -0.7).
- Red: Very weak ETFs that earn negative SQN scores (< -0.7).
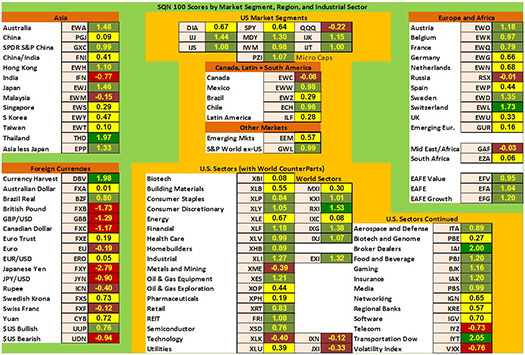
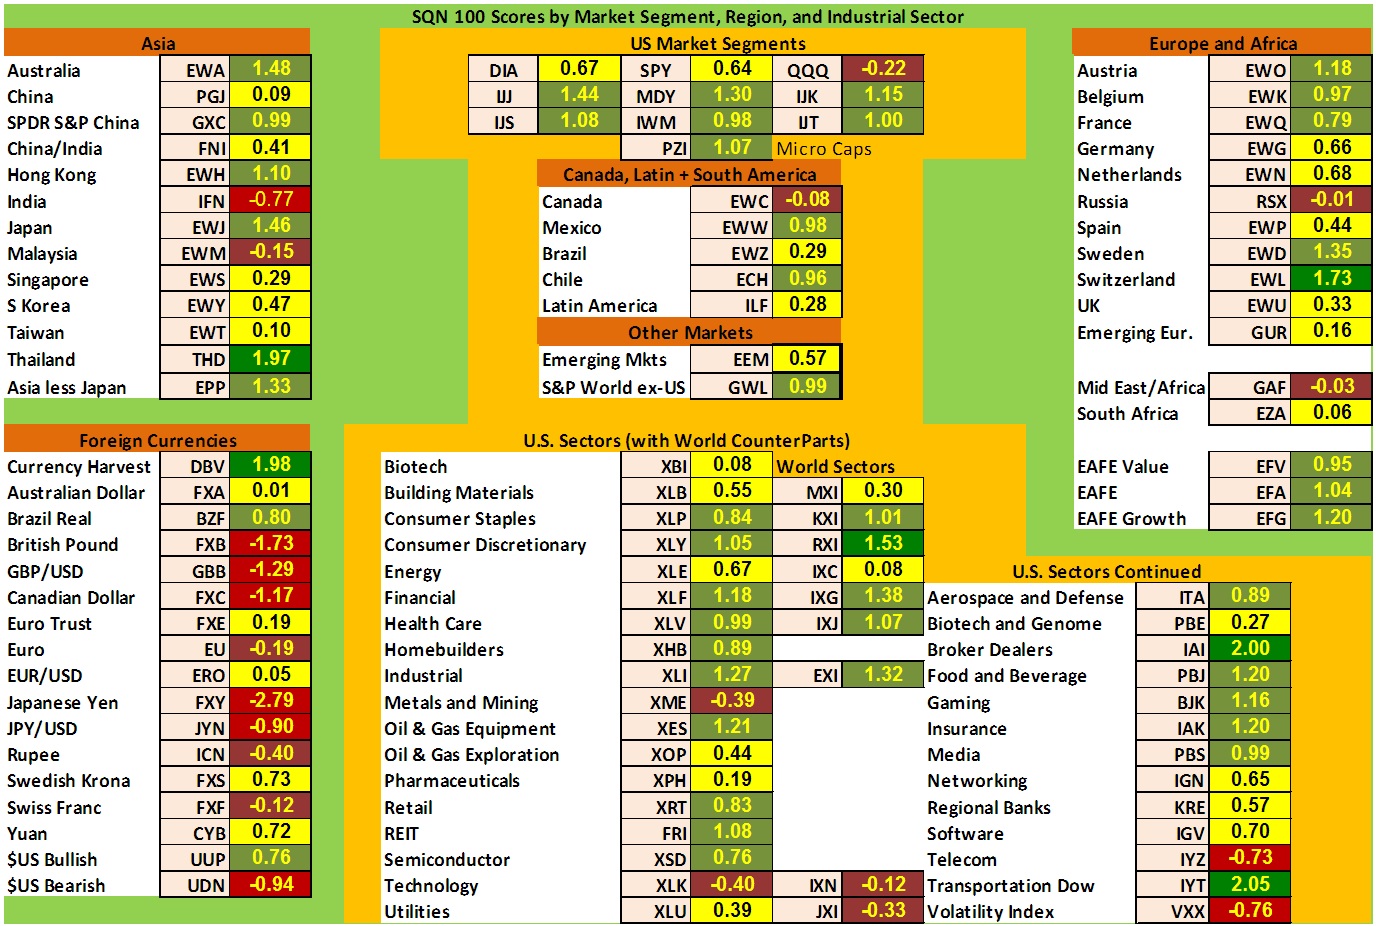
The world market model spreadsheet report below contains most currently available ETFs; including inverse funds, but excluding leveraged funds. In short, it covers the geographic world, the major asset classes, the equity market segments, the industrial sectors and the major currencies.
World Market Summary
Van was amazed at the amount of green he saw in the world market model in early February. In early March, there's less green in the model.
Let’s see what the situation looks like in the world market model.
There’s still a good amount of green in the summary table, though there are a number of new red ETFs – mostly in the currencies. Most of the US stock market segments are still light green, though across the spectrum, the large cap are now yellow or brown.
From a geographic viewpoint, Europe is now only about half green instead of all green, with the Middle East/Africa and Russia turning a weak brown. Asia is also about half green now and India went red or very weak this month.
About half of the Industrial Sectors are green. The Dow Transportation Index and Broker/Dealers are the strongest, while VXX remains the weakest.
The most weakness has shown up in the currencies category in the last month. There are only three green, currency-based ETFs left now – Currency Harvest, the Brazilian Real and the US Dollar, bullish. The rest of the currency ETFs are yellow, brown or red. The Japanese yen is not only the weakest currency; it showed up as the weakest ETF in the database this month – as it did last month as well.
(Click here for a larger view of this chart)
The next chart shows real estate, debt instruments, commodities and the top and bottom ETFs for the past 100 days.
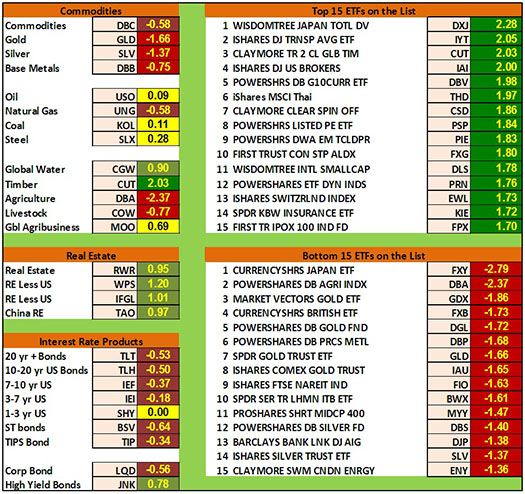
Debt based ETFs are all brown – weak – with the exceptions of High Yield and Short Term US Treasuries. The high yield ETF, JNK, is the only green ETF in the category.
Commodities also weakened overall last month. Timber and Global water are the only remaining green ETFs. Timber (CUT) is actually one of the strongest performing ETFs in the database. The metals, natural gas, agriculture and livestock ETFs are all red. Agriculture (DBA) is the second weakest ETF in the database.
Real Estate, as a category, is a small sea of green across the board.
As far as the strongest ETFs in the database, we went from six ETFs with SQN scores over two in the previous month to just four in February. At the top of the strongest list is DXJ – Japan Equities in contrast and coincident to the weakest ETF – the Japanese Yen. Also at the top of the strength list are the DJ Transport Index, Timber, US Brokers and the Currency Harvest ETF.
The weakest ETFs are a mix of currencies and commodities or commodity-oriented issues. Topping the weakest list are the Yen, Agriculture, Gold Miners, the British Pound and Gold.
What's Going On?
There was a broad, though somewhat mild, weakening for much of the world market model in February. Not one category had a move up. Overall, real estate remains the strongest category, debt remains the weakest, and currencies had the biggest move down.
Some view the dynamic currency fluctuations as evidence of a currency war with central banks across the globe trying to maintain a competitive trade advantage for their country. Interestingly, during an interview last week, Stan Druckenmiller offered an alternate interpretation of the situation. He views nations waging a monetary stimulation war as each tries to keep its economy up with a process of monetizing debt and encouraging inflation (battling deflation). Who is the leader with whom all these central banks have been trying to keep up? The US Federal Reserve.
Regardless, it will be interesting to see how all of this plays out and hopefully Van’s SQN Report will help you avoid some of the potholes along the road.
Crises always offer opportunities, but to capture those opportunities, you MUST know what you are doing. If you want to trade these markets, you need to approach them as a trader, not a long-term investor. We’d like to help you learn how to trade professionally; trying to navigate these markets without an education is hazardous to your wealth.
All the beliefs given in this update are my own. Though I find them useful, you may not. You can only trade your beliefs about the markets.
Ken's Class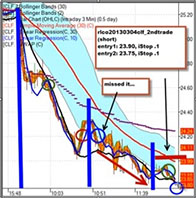
In this 13 minute case study, Ken connects his extensive weekend preparation to a swing trade opportunity he spotted to taking an intraday “turbo” trade in CLF for +4.5R.
Click Here to Watch the Video
Here’s a sample of Ken’s hour long weekend report with a view of the market, an important trading lesson on volatility. It clearly demonstrates the value of thorough preparation for the trading week.
Click Here to Watch the Video
 Thank you to everyone who participated in our Trading Beyond the Matrix launch week promotions! We are thrilled with the results and are so excited to see how lives will be touched through this book. Thank you to everyone who participated in our Trading Beyond the Matrix launch week promotions! We are thrilled with the results and are so excited to see how lives will be touched through this book.
The launch was extremely successful, so successful in fact, that The Matrix sold out in on-line bookstores. According to the feedback we are receiving from customers, you can still order it through Amazon and your book will be processed and shipped when it is back in stock. To purchase Trading Beyond the Matrix through Amazon, click here.
If you have not yet purchased the book, it's not too late to take advantage of some exclusive discounts with our new bonus pack! For more information on these special offers and how to receive them, go to Matrix.VanTharp.com.
For our international clients, we are very pleased to announce that Trading Beyond the Matrix will be available in bookstores worldwide very soon. We will keep you updated with information regarding the international release as we receive it.
Also, for those of you who have already finished reading the book we encourage you to write a review on Amazon.com. Thank you!
Ask Van...
Everything we do here at the Van Tharp Institute is focused on helping you improve as a trader and investor. Consequently, we love to get your feedback, both positive and negative!
Click here to take our quick, 6-question survey.
Also, send comments or ask Van a question by clicking here.
Back to Top
Contact Us
Email us at [email protected]
The Van Tharp Institute does not support spamming in any way, shape or form. This is a subscription based newsletter.
To change your e-mail Address, e-mail us at [email protected].
To stop your subscription, click on the "unsubscribe" link at the bottom left-hand corner of this email.
How are we doing? Give us your feedback! Click here to take our quick survey.
800-385-4486 * 919-466-0043 * Fax 919-466-0408
SQN® and the System Quality Number® are registered trademarks of the Van Tharp Institute
Be sure to check us out on Facebook and Twitter!
 
Back to Top |


