Tharp's Thoughts Weekly Newsletter (View On-Line)
-
Article Market Condition Neutral Quiet, by Van K. Tharp, Ph.D.
-
-
-
 Van's One Day Tharp Think Workshop is Next Weekend, January 12th Van's One Day Tharp Think Workshop is Next Weekend, January 12th
This mini-workshop provides an excellent low risk way to find out what you need to succeed long term as a trader to help you understand eight core areas of trading.
You will learn about: Achieving your objectives; risk; reward-to-risk ratio; systems as statistical distributions; trading systems in terms of sample theory; position sizing™ strategies; self-sabotage; and, last but not least, the psychological side of trading.
In addition, Van will present his famous System Quality Number® talk, and, you get to play Dr. Tharp’s marble game which produces major “ah-ha” experiences for traders like no book or lecture can about position sizing strategies.
All just $495. Plus, if you participate in Van's upcoming book promotion, you can get your tuition refunded! Learn about the workshop or Learn about the refund promotion.
Market Update for the Period Ending December 31, 2012 Market Condition: Neutral Quiet
by Van K. Tharp, Ph.D.
View On-line
I always say that people do not trade the markets; they trade their beliefs about the markets. Consequently, I'd like to point out that these updates reflect my beliefs. I find the market update information useful for my trading, so I do the work each month and am happy to share that information with my readers. If, however, your beliefs are not similar to mine, then this information may not be useful to you. If you are inclined to perform some sort of intellectual exercise to prove one of my beliefs wrong, simply remember that everyone can usually find lots of evidence to support their beliefs and refute others. Know that I acknowledge that these are my beliefs and that your beliefs may be different.
These updates are in the first issue of Tharp's Thoughts each month. This allows us to get the closing month's data. These updates cover 1) the market type (first mentioned in the April 30, 2008 edition of Tharp's Thoughts and readable on our web site), 2) the five-week status on each of the major U.S. stock market indices, 3) our four star inflation-deflation model plus John Williams' statistics, and 4) the movement of the dollar. I now report on the strongest and weakest areas of the overall market in a separate SQN® Report. I may come out with that report twice a month if there are significant market charges.—Van K. Tharp
Part I: Commentary—The Big Picture
I am writing this on January 2nd of the new year. The fiscal cliff has been postponed. The budget deal only increases taxes on those making over $400,000 ($450,000 is married filing jointly), the top 0.6% of Americans. The deal also postpones the spending cuts for two months, however, this is pretty meaningless as nothing was done except keep the mess going— spend a lot and make sure taxes don’t go up to match. And by the way, this was all done because the government can walk over to the Federal Reserve and write a check on money that doesn’t exist until it is printed out of nowhere.
The tax increases have been averted and the $1.2 trillion in spending cuts have been postponed for a few months. But Congress won’t significantly cut spending. In the bigger scheme of things, the tax increases plus the huge spending cuts would be a long term boon for the economy, but only if combined with a fiscally responsible congress (and when was the last time we had that?).
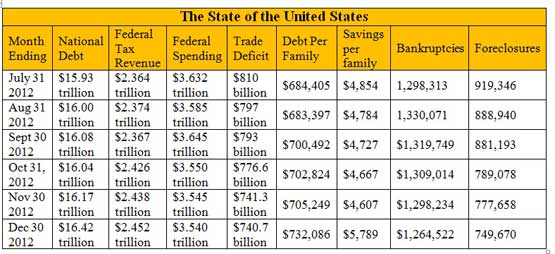
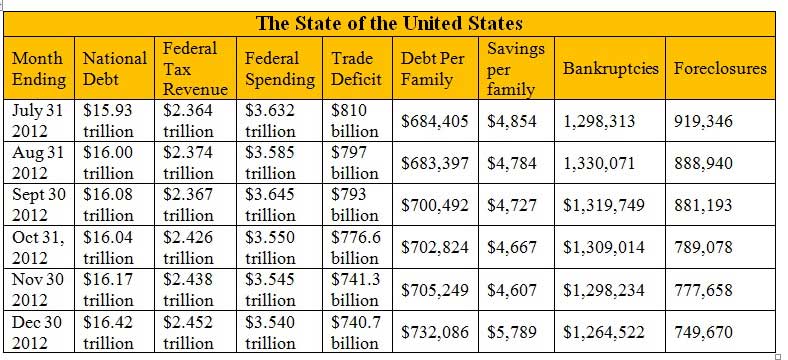
Right now, the deal is a short term boon for the equities market (which was way up on Monday), and a long term disaster. We have already reached the $16.4 trillion debt ceiling limit so now Congress has to raise that or the government can’t operate (meaning go to the Fed and borrow more money). So let’s look at the real long term picture — debt. According to the U.S. National Debt clock, (www.usdebtclock.org), our National Debt stands at $16.32 trillion. Federal tax revenue for the year is currently at $2.452 trillion while spending is at $3.54 trillion—over a 50% deficit over spending. The U.S. trade deficit for the year stands at $740.7 billion. The total debt in the US per family is $732,087 while the average family has less than $5,800 in savings. In addition, U.S. unfunded liabilities now total $122,094 trillion—or over one million per taxpayer. Do you see any way to overcome these problems that doesn’t hurt? Do you understand what I mean by terrible fundamentals?
The debt clock also shows this month’s population for the US at 315 million. We have a work force of 143.5 million supporting 62.1 million retirees or social security recipients. 48.8 million food stamp recipients are included in that population. And so far this year, there have been 1.3 million bankruptcies and 749,667 foreclosures. The site recently started tracking data second by second and I’ll update you monthly with its figures so you can see the changes over time. View On-line
View Larger
Some of the numbers may go down or up and not make sense, but I’m just reporting the monthly figures as I see them on the debt clock. As reported, the bankruptcies and foreclosures figures don’t make sense to me unless they are rolling 12 month windows. Watching the debt grow by a half trillion in six months has been quite interesting.
Part II: The Current Stock Market Type Is Neutral Quiet
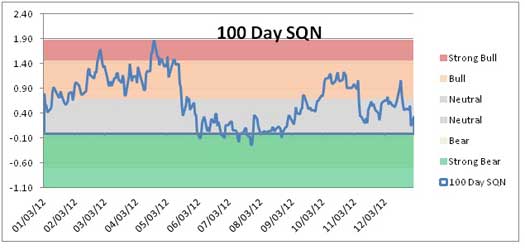
Each month, I look at the market SQN® score for the daily percent changes in the S&P 500 Index over 200, 100, 50 and 25 days. For our purposes, the S&P 500 Index defines the market. The market SQN helps me understand the market’s trend. The 25, 100 and 200-day SQNs are neutral; the 50 day is now showing bear. These are exactly the same as last month.
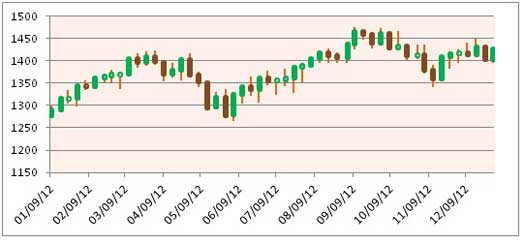
Here’s a weekly candlestick chart of the S&P 500. The results since September are flat to slightly down.
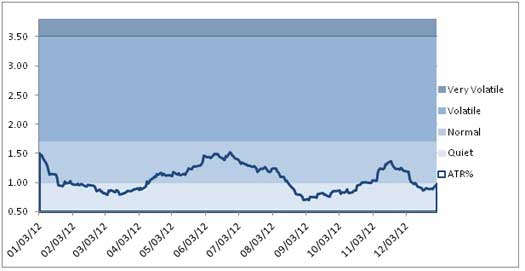
The next graph shows that the volatility has crept back to quiet. As a result, I’m not expecting any serious down moves because the market lacks volatility. Since bear markets are usually in the very volatile range or at least in the volatile range, we have a little room to go before that happens. The volatility based ETF, VXX remains very weak.
The next chart shows the activity of the three major U.S. indices.at the closing Friday of each week. The market is not so strong anymore, partially due the down movement in AAPL which certainly affects the NASDAQ 100. Nevertheless, both the S&P 500 and the NASDAQ 100 were up over 10% in 2012.
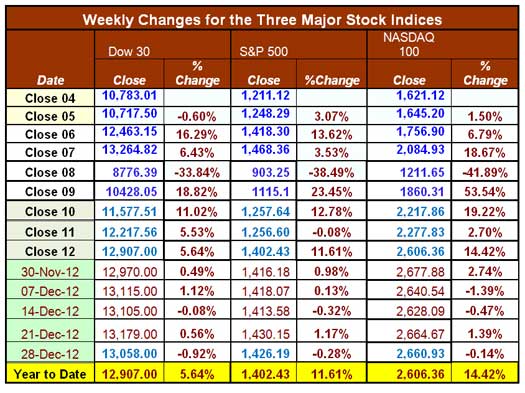
Overall, 2012 was positive, in fact, probably a little better than inflation with both the S&P 500 and the NASDAQ 100 being in double digits. Lastly, Jason Goepfert’s Daily Sentiment Report for December 31st suggests that smart money is 42% confident in a rally and dumb money is 50% confident. That’s a pretty neutral picture that reflects our market type description.
Part III: Our Four Star Inflation-Deflation Model
In the simplest terms, inflation means that stuff gets more expensive, and deflation means that stuff gets cheaper. There’s a correlation between the inflation rate and market levels, so the inflation rate can help traders understand big-picture processes. Here is my four star inflation-deflation model for the last few years.
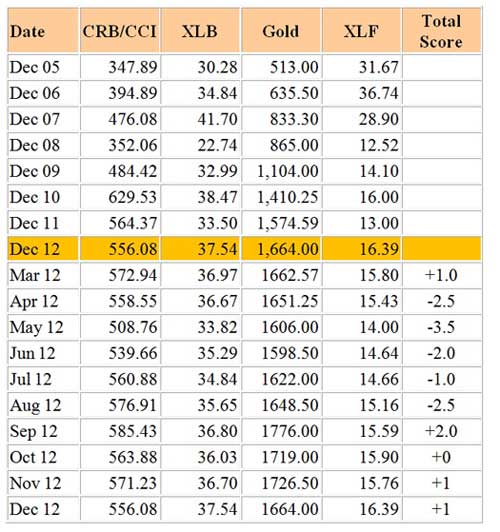
Looking back over the most recent two-month and six-month periods provides the current month's score, given in the table below.
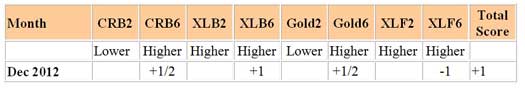
So now we’ve shown a slight inflationary tendency for two months. Three of the last four months in 2012 showed an inflationary tendency. What’s much more interesting is to look at the price of gold at the end of each year for seven years. Each year shows an increase in price. And if I had a few more years I’m sure the trend would be the same.
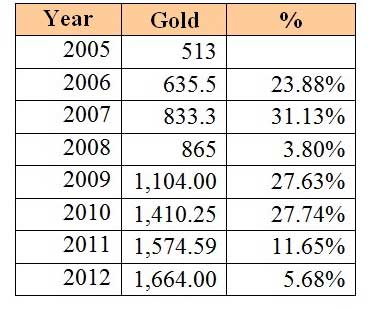
We have had almost a 25% increase in the price of gold in four of the six years. Most of you would have performed quite well just by holding gold. Shadowstats.com still shows that the real inflation rate is about 5%. And based upon those statistics, the GDP has shown negative growth since 2000 (meaning recession) in all but one quarter of 2003.
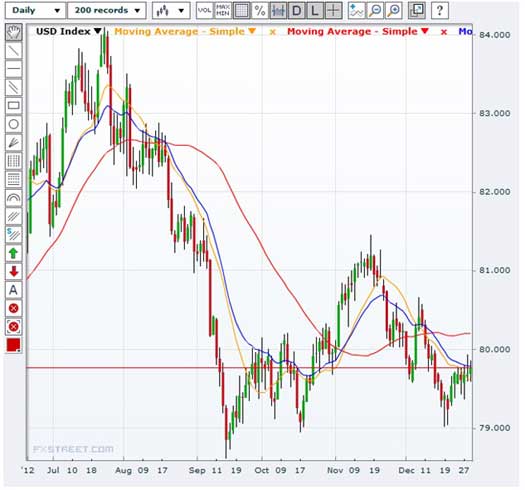
Part IV: Tracking the Dollar
Look what has happened to the US dollar since August. We had a huge decline from 84 to below 79. Then we have had a slight up movement that is now fluctuating around 80. I said the same thing last month and nothing has changed.
General Comments
We’re getting into the time of the year when pension money flows into the market. But next month we should know more about the potential short term fiscal cliff and what the government will probably do to create an even worse long term scenario.
But the world didn’t end on Dec 2012 :) and perhaps Congress will even show some enlightenment. We’ll see next month.
These monthly market updates are not intended for predictive purposes; rather, they’re intended to help traders decide which of their trading systems should work best in the current market conditions. In bear markets—which are almost always volatile by nature—shorter-term strategies, and those that allow going short, tend to work better than long-only or intermediate/longer-term systems. Which of your trading systems fit this current market type? Of course, this question implies that you have multiple trading systems and that you know how they perform under various market conditions. If you haven't heard of this concept or the other concepts mentioned above, read my book Super Trader, which covers these areas and more, so that you can make money in any kind of market conditions.
Crisis always implies opportunity. Those with good trading skills can make money in this market—a lot of money. There were lots of good opportunities in 2011 and, so far, many more in 2012. Did you make money? If not, then do you understand why not? The refinement of good trading skills doesn't just happen by opening an account and adding money. You probably spent years learning how to perform your current job at a high skill level. Do you expect to perform at the same high level in your trading without similar preparation? Financial market trading is an arena filled with world-class competition. Additionally and most importantly, trading requires massive self-work to produce consistent, large profits under multiple market conditions. Prepare yourself to succeed with a deep desire, strong commitment and the right training.
About the Author: Trading coach and author Van K. Tharp, Ph.D. is widely recognized for his best-selling books and outstanding Peak Performance Home Study Program—a highly regarded classic that is suitable for all levels of traders and investors. You can learn more about Van Tharp at www.vantharp.com. His new book, Trading Beyond The Matrix, is expected for publication February 2013.
Trading Education
$700 Discount Expires Next Week, January 9, On Peak 101
(US Date Only)
January—USA, NC • March—Australia
January 12 |
Tharp Think; One-Day Workshop.
Click here to see the refund promotion.
|
| January 18-20 |
Peak Performance 101
Discount Expires Next Week, Jan 9. |
| February 8-10 |
How to Develop A Winning Trading System Workshop
This will be the only US date for this workshop in 2013 |
| February 12-14 |
Blueprint for Trading Success
This will be the only US date for this workshop in 2013 |
|
Van Returns to Australia!
|
March 1-3 |
Peak Performance 101 - Australia |
March 5-8 |
Peak Performance 202- Australia
|
March 15-17 |
Peak Performance 203 - Australia
"The Happiness" Workshop
|
To see the schedule, including dates, prices, combo discounts and location, click here.
Trading Tip
December 2012 SQN® Report
by Van K. Tharp, Ph.D.
View On-line
There are numerous ETFs that now track everything from countries, commodities, currencies and stock market indices to individual market sectors. ETFs provide a wonderfully easy way to discover what’s happening in the world markets. Consequently, I now use the System Quality Number® (SQN®) score for 100 days to measure the relative performance of numerous markets in a world model.
The SQN 100 score uses the daily percent change for a 100-day period. Typically, an SQN score over 1.45 is strongly bullish; a score below -0.7 is very weak. We use the following color codes to help communicate the strength or weakness of the ETFs.
• Green: ETFs with very strong SQN scores (0.75 to 1.5).
• Yellow: ETFs with slightly positive SQN scores (0 to 0.75).
• Brown: ETFs with slightly negative SQN scores (0 to -0.7).
• Red: Very weak ETFs that earn negative SQN scores (< -0.7).
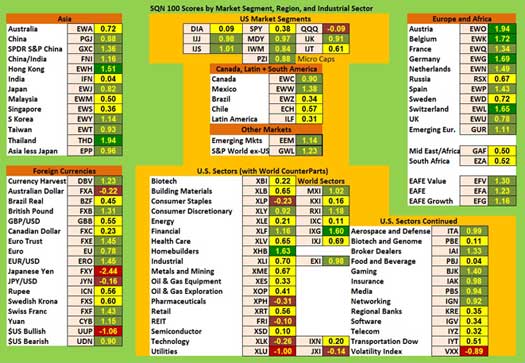
The world market model spreadsheet report below contains most currently available ETFs, including inverse funds, but excludes leveraged funds. In short, it covers the geographic world, the major asset classes, the equity market segments, the industrial sectors and the major currencies.
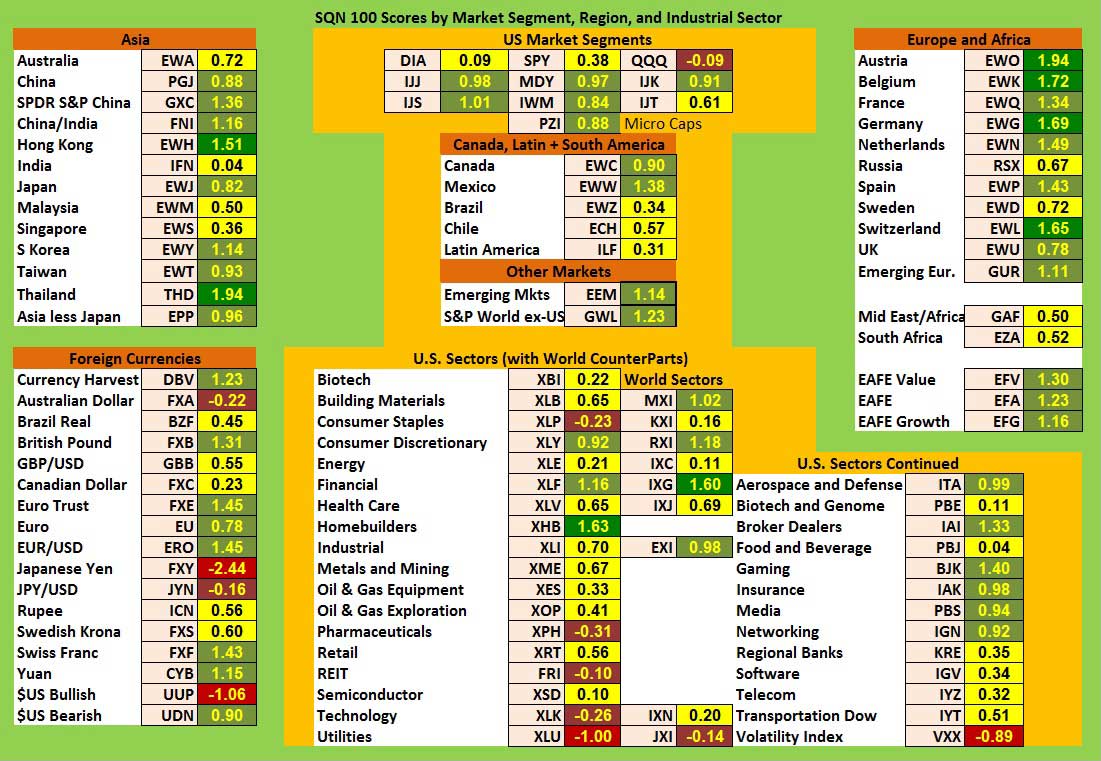
World Market Summary
The SQN world market summary is still green with a little more yellow than last month. View On-line
View Larger Chart
The end of the world wasn’t so bad after all. There is one brown area in the US market segments, QQQ primarily because of AAPL. There are a number of other brown areas including: 1) the Aussie dollar; 2) consumer staples; 3) pharmaceuticals; 4) REITs, and 5) technology (AAPL?)
There are several red areas: 1) the US dollar up; 2) the Japanese Yen, 3) Utilities; and 4) the VXX.
Several countries are quite strong. In order of strength, they are: 1) Austria: 2) Thailand: 3) Belgium; 4) Germany; 5) Switzerland; and 6) Hong Kong.
Among sectors, US Homebuilders and Aerospace-Defense are dark green.
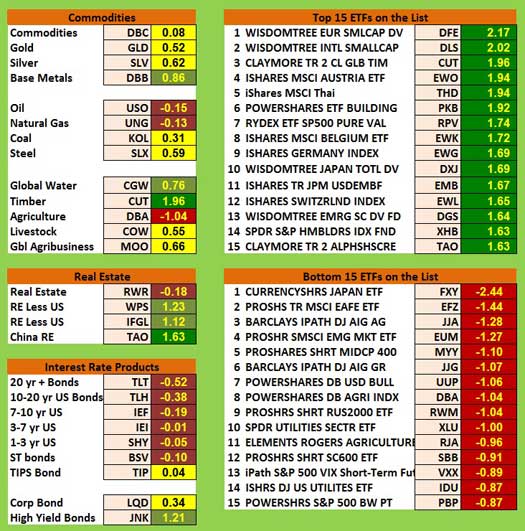
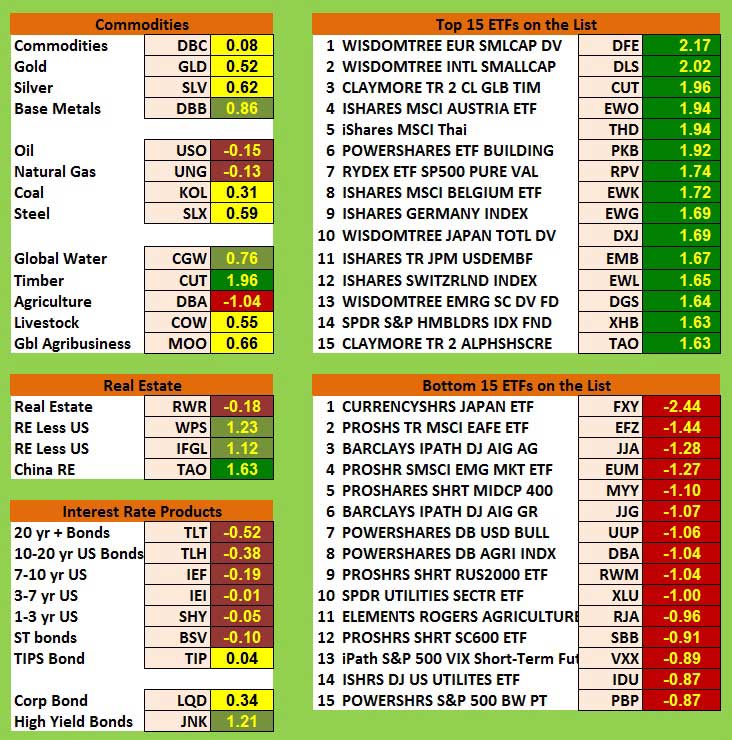
The next chart shows real estate, debt instruments, commodities, and the top and bottom ETFs for the past 100 days.
View Larger Chart
People are moving out of bonds as all of the longer term bonds ETFs are now brown except for the inflation protected bonds and the corporate bonds which are yellow. Junk bonds are more popular being light green.
Among commodities, agriculture is now red, while oil and natural gas are brown.
Commodities, gold, silver, and base metals all look stronger. Among commodities, agriculture is now red, while oil and natural gas are brown. Timber is very strong, while global water and base metals are light green. All of the rest of the commodities are yellow.
Out of all the ETFs in the database, the strongest are international small cap stocks; timber, Austria, Thailand, Belgium, Germany and Builders. These have generally been mentioned before so no hidden areas appeared this month.
By far, the weakest ETF is the Japanese Yen. Perhaps is time for me to do some consulting in Japan to help them strengthen their currency? I noticed that the Aussie dollar is weak, but not as much as the US dollar. And when I checked, the Aussie dollar is still lower than the US dollar. While the exchange rate is still good, there’s time left for last minute enrollments in our March workshops in Sydney.
What's Going On?
Big money is learning to move their money around rapidly because there just are not that many long term trends any more. Everything changes from month to month because of the amount of uncertainly that exists in all countries. One of my own trading strategies has been to hold REIT positions about this time of the year, but even these are now weak.
Fundamentally, the U.S. is in the worst shape it’s been in a long, long time. Our debt looks asymptotic and the dollar could one day (next year or a decade from now) be dismissed as the world’s reserve currency. Europe and China don’t look that good either. Perhaps it is the end of the world, :) , but the market remains pretty neutral with no sign of increasing volatility.
Crises always offer opportunities, but to capture those opportunities you MUST know what you are doing. If you want to trade these markets, you need to approach them as a trader, not a long-term investor. We’d like to help you learn how to trade professionally. Trying to navigate these markets without an education is hazardous to your wealth.
All the beliefs given in this update are my own. Though I find them useful, you may not. You can only trade your beliefs about the markets.
Until next month, this is Van Tharp.
Ken's Class
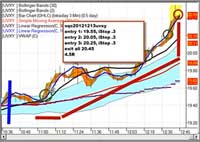 In this short video, Ken details his preparation and trades on Monday, December 31. He explains a little about a new indicator he uses and how it helped alert him to the potential for a strong reversal. Luck rewards the prepared as Ken took a series of trades to close out the 2012 trading year with a +20R afternoon. In this short video, Ken details his preparation and trades on Monday, December 31. He explains a little about a new indicator he uses and how it helped alert him to the potential for a strong reversal. Luck rewards the prepared as Ken took a series of trades to close out the 2012 trading year with a +20R afternoon.
http://youtu.be/5iAAS-_3z7M
Ask Van...
Everything we do here at the Van Tharp Institute is focused on helping you improve as a trader and investor. Consequently, we love to get your feedback, both positive and negative!
Click here to take our quick, 6-question survey.
Also, send comments or ask Van a question by clicking here.
Back to Top
Contact Us
Email us at [email protected]
The Van Tharp Institute does not support spamming in any way, shape or form. This is a subscription based newsletter.
To change your e-mail Address, e-mail us at [email protected].
To stop your subscription, click on the "unsubscribe" link at the bottom left-hand corner of this email.
How are we doing? Give us your feedback! Click here to take our quick survey.
800-385-4486 * 919-466-0043 * Fax 919-466-0408
SQN® and the System Quality Number® are registered trademarks of the Van Tharp Institute
Back to Top |


