Tharp's Thoughts Weekly Newsletter (View On-Line)
-
Article Market Condition: Neutral Normal by Van K. Tharp, Ph.D.
-
-
-
Gold Report A Gold Analysis for December by Florian Grummes
 In January Van will be holding his one-day Tharp Think Workshop. In January Van will be holding his one-day Tharp Think Workshop.
Learn the 8 core areas of trading, directly from Van, for only $495.
Plus, we have a special promotion for this workshop. Buy 10 of Van's new book, and get a full refund on the workshop! Learn More...
Market Update for the Period Ending November 31, 2012
Market Condition: Neutral Normal
by Van K. Tharp, Ph.D.
I always say that people do not trade the markets; they trade their beliefs about the markets. Consequently, I'd like to point out that these updates reflect my beliefs. I find the market update information useful for my trading, so I do the work each month and am happy to share that information with my readers.
If, however, your beliefs are not similar to mine, then this information may not be useful to you. If you are inclined to perform some sort of intellectual exercise to prove one of my beliefs wrong, simply remember that everyone can usually find lots of evidence to support their beliefs and refute others. Know that I acknowledge that these are my beliefs and that your beliefs may be different.
These updates are in the first issue of Tharp's Thoughts each month. This allows us to get the closing month's data. These updates cover 1) the market type (first mentioned in the April 30, 2008 edition of Tharp's Thoughts and readable on our web site), 2) the five-week status on each of the major U.S. stock market indices, 3) our four star inflation-deflation model plus John Williams' statistics, and 4) the movement of the dollar. I now report on the strongest and weakest areas of the overall market in a separate SQN® Report. I may come out with that report twice a month if there are significant market charges.—Van K. Tharp
Part I: Commentary—The Big Picture
Unless the president and congress can reach an agreement in the next few weeks, a convergence of tax increases and spending cuts will basically throw the economy into a recession (even though we’ve unofficially been in one since 2000). Almost every tax cut enacted since 2001 is set to expire at the end of the year. The tax bite for the average American household will be $3,500. Even Obama’s 2009 economic stimulus tax cuts will expire. In addition, $1.2 trillion in spending cuts will also start. The Republicans have rejected a proposal from Obama and he’s rejected their proposal. So the mess looms.
One minute the stock market is okay because it thinks someone will compromise and do something rational. And another minute the stock market crashes because it thinks the stalemate will persist. At least, this is the media take on what is happening. However, I can guarantee that nothing rational will be done because anything that is rational would be political suicide for a president who no longer has anything to lose because he’s serving his last term.
Add to that the fact that we’re already in a recession (based upon read CPI numbers and not the fake government statistics) and you can get some perspective on the true size of the mess ahead. Aside from QE3 (which is having difficulty keeping sustained trends in a mild bull market), there is nothing too optimistic ahead. But then again, crisis always inspires opportunity somewhere.
According to the U.S. National Debt clock, (www.usdebtclock.org), our National Debt stands at $16.23 trillion. Federal tax revenue for the year is currently at $2.438 trillion while spending is at $3.42 trillion – more than a 50% spending deficit over revenue. The U.S. trade deficit for the year stands at $741.37 billion. The total US debt per family is $705,533 while the average family has less than $4,600 in savings. In addition, U.S. unfunded liabilities now total $121.729 trillion - or over one million dollars per taxpayer. Do you see any way to overcome these problems that won’t hurt? Do you understand what I mean by terrible fundamentals?
The debt clock also shows this month’s population for the US at 314.9 million people. We have a work force of 143.7 million supporting 68.226 million retirees or social security recipients. 47.7 million food stamp recipients are included in that population. And so far this year, there have been 1.3 million bankruptcies and 776,330 foreclosures.
The site recently started tracking data second by second and I’ll update you monthly with its figures so you can see the changes over time.
The State of the United States |
Month Ending |
National Debt |
Federal Tax Revenue |
Federal Spending |
Trade Deficit |
Debt Per Family |
Savings per family |
Bankruptcies |
Fore-closures |
July 31 2012 |
$15.93 trillion |
$2.364 trillion |
$3.632 trillion |
$810 billion |
$684,405 |
$4,854 |
1,298,313 |
919,346 |
Aug 31 2012 |
$16.00 trillion |
$2.374 trillion |
$3.585 trillion |
$797 billion |
$683,397 |
$4,784 |
1,330,071 |
888,940 |
Sept 30 2012 |
$16.08 trillion |
$2.367 trillion |
$3.645 trillion |
$793 billion |
$700,492 |
$4,727 |
$1,319,749 |
881.193 |
Oct 31, 2012 |
$16.04 trillion |
$2.426 trillion |
$3.550 trillion |
$776.6 billion |
$702,824 |
$4,667 |
$1,309,014 |
789,078 |
Nov30, 2012 |
$16.17 trillion |
$2.438 trillion |
$3.545 trillion |
$741.3 billion |
$705,249 |
$4,607 |
$1,298,234 |
$777,658 |
Some of the numbers may go down or up and not make sense, but I’m just reporting the monthly figures as I see them on the debt clock.
It has been an election year with whatever effects that has on the economy and the market about to end now. November began the favorable six months of the year for the seasonal trend of pension money flowing into the stock market. So we’ll have both that and QE 3 supporting the market. In my opinion, however, QE3 is just the Fed’s way of supporting its owners —the big banks
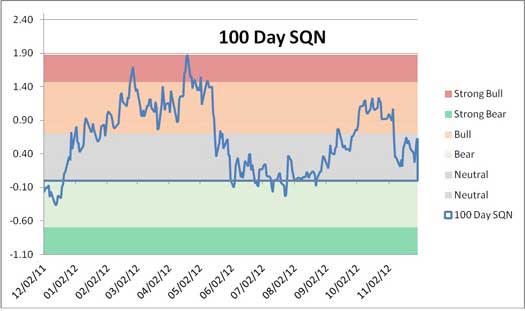
Part II: The Current Stock Market Type Is Neutral Normal
Each month, I look at the market SQN® score for the daily percent changes in the S&P 500 Index over 200, 100, 50 and 25 days. For our purposes, the S&P 500 Index defines the market.
The 25, 100 and 200-day market SQNs are neutral, while the 50 day has shifted to bear. So obviously the short term trend is now down.
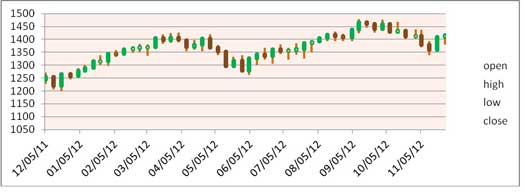
Here’s a weekly candlestick chart of the S&P 500.
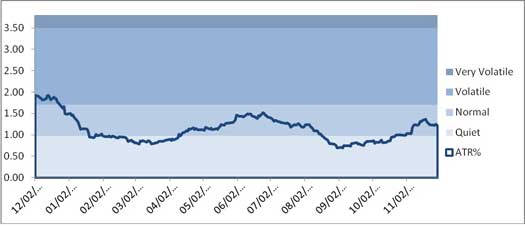
The next graph shows that volatility has crept up into the normal range for the market over the last two months. And since bear markets are usually very volatile or at least volatile, we have a little room to go before that happens. The volatility ETF (VXX) remains very weak.
The next table tracks the activity of the three major U.S. indices at the closing Friday of each week for the last month and the close for past recent years. The indexes not so strong anymore, partially due the down movement in AAPL which certainly affects the NASDAQ 100 the most. Nevertheless, both the S&P 500 and the NASDAQ 100 are still up over 10% this year.
Weekly Changes for the Three Major Stock Indices |
|
Dow 30 |
S&P 500 |
NASDAQ 100 |
Date |
Close |
% Change |
Close |
%Change |
Close |
% Change |
Close 04 |
10,783.01 |
|
1,211.12 |
|
1,621.12 |
|
Close 05 |
10,717.50 |
-0.60% |
1,248.29 |
3.07% |
1,645.20 |
1.50% |
Close 06 |
12,463.15 |
16.29% |
1,418.30 |
13.62% |
1,756.90 |
6.79% |
Close 07 |
13,264.82 |
6.43% |
1,468.36 |
3.53% |
2,084.93 |
18.67% |
Close 08 |
8,776.39 |
-33.84% |
903.25 |
-38.49% |
1,211.65 |
-41.89% |
Close 09 |
10,428.05 |
18.82% |
1,115.1 |
23.45% |
1,860.31 |
53.54% |
Close 10 |
11,577.51 |
11.02% |
1,257.64 |
12.78% |
2,217.86 |
19.22% |
Close 11 |
12,217.56 |
5.53% |
1,256.60 |
-0.08% |
2,277.83 |
2.70% |
01-Nov-12 |
13,033.00 |
6.67% |
1,427.59 |
13.61% |
2,656.28 |
16.61% |
08-Nov-12 |
12,759.00 |
-2.10% |
1,377.51 |
-3.51% |
2,584.10 |
-2.72% |
15-Nov-12 |
12,560.00 |
-1.56% |
1,353.33 |
-1.76% |
2,534.16 |
-1.93% |
23-Nov-12 |
12,952.00 |
3.12% |
1,409.15 |
4.12% |
2,651.67 |
4.64% |
30-Nov-12 |
12,955.00 |
0.02% |
1,416.18 |
0.50% |
2,671.84 |
0.76% |
Year to Date |
12,955.00 |
6.04% |
1,416.18 |
12.70% |
2,671.84 |
17.30% |
Lastly, Jason Goepfert’s Daily Sentiment Report for December 3rd suggests that smart money is 46% confident in a rally and dumb money is 58% confident. That’s a slightly negative, but still pretty neutral picture that answers our market type description.
Part III: Our Four Star Inflation-Deflation Model
In the simplest terms, inflation means that stuff gets more expensive, and deflation means that stuff gets cheaper. There’s a correlation between the inflation rate and market levels, so the inflation rate can help traders understand big-picture processes. Commodities are down and the last two months have mildly deflationary trends but the six month measurements are now inflationary. And in a deflationary market, cash is king.
Here is my four star inflation-deflation model for the last few years.
| Date |
CRB/CCI |
XLB |
Gold |
XLF |
Total Score |
| Dec 05 |
347.89 |
30.28 |
513.00 |
31.67 |
|
| Dec 06 |
394.89 |
34.84 |
635.50 |
36.74 |
|
| Dec 07 |
476.08 |
41.70 |
833.30 |
28.90 |
|
| Dec 08 |
352.06 |
22.74 |
865.00 |
12.52 |
|
| Dec 09 |
484.42 |
32.99 |
1,104.00 |
14.10 |
|
| Dec 10 |
629.53 |
38.47 |
1,410.25 |
16.00 |
|
| Dec 11 |
564.37 |
33.50 |
1,574.59 |
13.00 |
|
| Mar 12 |
572.94 |
36.97 |
1,662.57 |
15.80 |
+1.0 |
| Apr 12 |
558.55 |
36.67 |
1,651.25 |
15.43 |
-2.5 |
| May 12 |
508.76 |
33.82 |
1,606.00 |
14.00 |
-3.5 |
| Jun 12 |
539.66 |
35.29 |
1,598.50 |
14.64 |
-2.0 |
| Jul 12 |
560.88 |
34.84 |
1,622.00 |
14.66 |
-1.0 |
| Aug 12 |
576.91 |
35.65 |
1,648.50 |
15.16 |
-2.5 |
| Sep 12 |
585.43 |
36.80 |
1,776.00 |
15.59 |
+2.0 |
| Oct 12 |
563.88 |
36.03 |
1,719.00 |
15.90 |
0 |
| Nov12 |
571.23 |
36.70 |
1726.50 |
15.76 |
+1 |
Looking back over the most recent two-month and six-month periods provides the current month's score, given in the table below.
Month |
CRB
2 Mo |
CRB
6 Mo |
XLB
2 Mo |
XLB
6 Mo |
Gold
2 Mo |
Gold
6 Mo |
XLF
2 Mo |
XLF
6 Mo |
Total Score |
|
Lower |
Higher |
Lower |
Higher |
Higher |
Higher |
Higher |
Higher |
|
August 2012 |
|
+1/2 |
|
+1/2 |
|
+1 |
|
-1 |
+1 |
So far in 2012, November is only the third month to have shown an inflationary tendency. If we get another inflationary score in December, we might have the start of a possible trend.
Shadowstats.com still shows that the real inflation rate is about 5%. And based upon those statistics, the GDP has shown negative growth since 2000 (meaning recession) in all but one quarter of 2003.
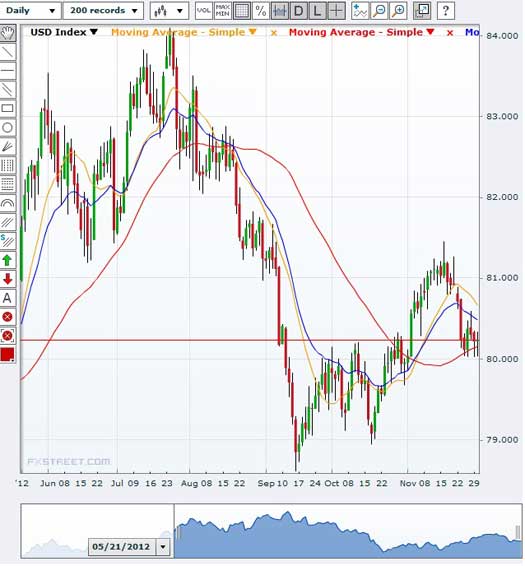
Part IV: Tracking the Dollar
Since mid-September, the dollar has been trending up and retraced about half of its late summer decline. It has fallen back off some, however, since mid-November.
General Comments
We’re getting into the time of the year when pension money flows into the market. And at the same time, the US faces a huge crisis at the end of the year and there’s little bi-partisan support to fix it. Isn’t the world supposed to end this month? We’ll see.
These monthly market updates are not intended for predictive purposes; rather, they’re intended to help traders decide which of their trading systems should work best in the current market conditions. In bear markets—which are almost always volatile by nature—shorter-term strategies, and those that allow going short, tend to work better than long-only or intermediate/longer-term systems.
Which of your trading systems fit this current market type? Of course, this question implies that you have multiple trading systems and that you know how they perform under various market conditions. If you haven't heard of this concept or the other concepts mentioned above, read my book Super Trader, which covers these areas and more, so that you can make money in any kind of market conditions.
Crisis always implies opportunity. Those with good trading skills can make money in this market—a lot of money. There were lots of good opportunities in 2011 and, so far, many more in 2012. Did you make money? If not, then do you understand why not? The refinement of good trading skills doesn't just happen by opening an account and adding money. You probably spent years learning how to perform your current job at a high skill level. Do you expect to perform at the same high level in your trading without similar preparation? Financial market trading is an arena filled with world-class competition. Additionally and most importantly, trading requires massive self-work to produce consistent, large profits under multiple market conditions. Prepare yourself to succeed with a deep desire, strong commitment and the right training.
About the Author: Trading coach and author Van K. Tharp, Ph.D. is widely recognized for his best-selling books and outstanding Peak Performance Home Study Program—a highly regarded classic that is suitable for all levels of traders and investors. You can learn more about Van Tharp at www.vantharp.com. His new book, Trading Beyond The Matrix, is expected for publication March 2013.
Trading Education
Workshops
Learn How You Can Get A Full Refund on Van's January 12th Workshop.
January 12 |
New Addition! Tharp Think; One-Day Workshop.
Click here to see the refund promotion.
|
| January 18-20 |
Peak Performance 101
Required for All Super Trader Candidates |
| February 8-10 |
How to Develop A Winning Trading System Workshop
This will be the only US date for this workshop in 2013 |
| February 12-14 |
Blueprint for Trading Success
This will be the only US date for this workshop in 2013 |
|
Van Returns to Australia!
|
March 1-3 |
Peak Performance 101 - Australia |
March 5-8 |
Peak Performance 202- Australia
|
March 15-17 |
Peak Performance 203 - Australia
"The Happiness" Workshop
|
To see the schedule, including dates, prices, combo discounts and location, click here.
Trading Tip
November 2012 SQN® Report
by Van K. Tharp
There are numerous ETFs that now track everything from countries, commodities, currencies and stock market indices to individual market sectors. ETFs provide a wonderfully easy way to discover what’s happening in the world markets. Consequently, I now use the System Quality Number® (SQN®) score for 100 days to measure the relative performance of numerous markets in a world model.
The SQN 100 score uses the daily percent change for a 100-day period. Typically, an SQN score over 1.45 is strongly bullish; a score below -0.7 is very weak. We use the following color codes to help communicate the strength or weakness of the ETFs.
- Green: ETFs with very strong SQN scores (0.75 to 1.5).
- Yellow: ETFs with slightly positive SQN scores (0 to 0.75).
- Brown: ETFs with slightly negative SQN scores (0 to -0.7).
- Red: Very weak ETFs that earn negative SQN scores (< -0.7).
The world market model spreadsheet report below contains most currently available ETFs, including inverse funds, but excluding leveraged funds. In short, it covers the geographic world, the major asset classes, the equity market segments, the industrial sectors and the major currencies.
World Market Summary
The SQN world market summary is still largely green so it must not be too concerned about the predicted end of the world this month. And there are no red areas except for the Japanese Yen and the volatility ETF. Most of the US stock market is light green except for small caps. Europe is totally green except for Russia while Asia is all green except for China, Japan, and Malaysia. The only brown on the start is the Yen/Dollar, Chile, The Brazilian Real, and a few US sectors -- Biotech, Pharmaceuticals, REITs, and Utilities.
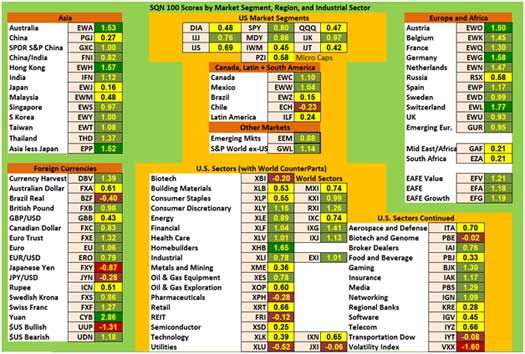
View Larger
The next table shows real estate, debt instruments, commodities, and the top and bottom ETFs for the past 100 days.
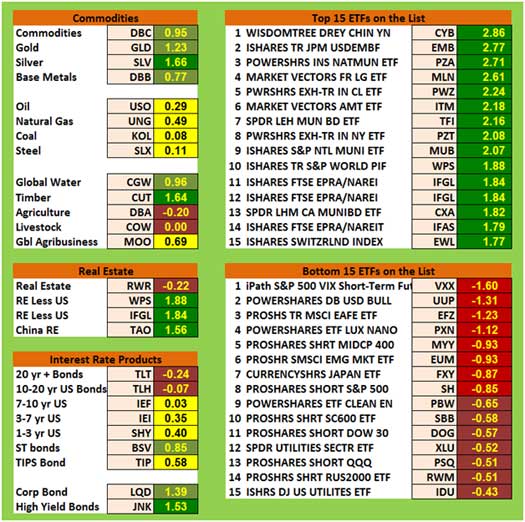
View Larger
People are moving out of bonds as all of the longer term bonds are now yellow to brown. And only junk bonds are green, while corporate bonds and short term bonds are light green.
Among the commodities, Agriculture and Livestock are brown, while oil, natural gas, coal and steel are yellow. No commodity group is red. Gold, silver, and base metals all look stronger while timber and global water look very strong.
The real strength seems to be in interesting areas that we don’t regularly measure, including:
- Emerging market bonds
- Various muni bond funds
It’s beginning to look like one of those should be included in our list.
The weakest areas seem to be the VXX, which we have already mentioned, plus various funds that are short some of the major indices such as emerging markets, the midcap 400, and the yen.
What's Going On?
Because no one knows anything, including the picture with most Federal bonds, people are looking for a different kind of safety in municipal bonds. But these days, just wait two months and those bonds may become very weak. I’m not particularly excited about anything, same as last month. Although most of the REITs are about to pay dividends and their prices are depressed which is quite unusual. The mortgages are still guaranteed and I see no sign of interest rates going up.
Fundamentally, the U.S. is in the worst shape it’s been in a long, long time. Our debt looks asymptotic and the dollar (despite its recent rise to the upside) could be dismissed as the world’s reserve currency. Europe and China don’t look that good either. Perhaps it is the end of the world, : ) , but the market remains pretty neutral with no sign of increasing volatility.
Crises always offer opportunities, but to capture those opportunities you MUST know what you are doing. If you want to trade these markets, you need to approach them as a trader, not a long-term investor. We’d like to help you learn how to trade professionally. Trying to navigate these markets without an education is hazardous to your wealth.
All the beliefs given in this update are my own. Though I find them useful, you may not. You can only trade your beliefs about the markets.
Until next month, this is Van Tharp.
20% Off Sale is Going On Now
For a limited time, all of Van Tharp's Products are 20% off. And with our Home Study combo deal you save close to 25%.
See What's on Sale...
Gold Report
Gold Analysis and Strategy: December 4, 2010
by Florian Grummes
Florian has started writing his Midas Touch Gold Report in English again! From time to time we'll share his report with you. Click here to see the December report.
About the Author: Florian Grummes (born 1975 in Munich) has been studying and trading the gold market since 2003. In addition to his trading business, he is a very creative and successful composer, songwriter and music producer.
Ask Van...
Everything we do here at the Van Tharp Institute is focused on helping you improve as a trader and investor. Consequently, we love to get your feedback, both positive and negative!
Click here to take our quick, 6-question survey.
Also, send comments or ask Van a question by clicking here.
Back to Top
Contact Us
Email us at [email protected]
The Van Tharp Institute does not support spamming in any way, shape or form. This is a subscription based newsletter.
To change your e-mail Address, e-mail us at [email protected].
To stop your subscription, click on the "unsubscribe" link at the bottom left-hand corner of this email.
How are we doing? Give us your feedback! Click here to take our quick survey.
800-385-4486 * 919-466-0043 * Fax 919-466-0408
SQN® and the System Quality Number® are registered trademarks of the Van Tharp Institute
Back to Top |
|
December 04, 2012 - Issue 606


A Must Read for All Traders
Super Trader
How are we doing?
Give us your feedback!
Click here to take our quick survey.
From our reader survey...
"I think the newsletter is extremely generous and it is a resource I utilize constantly. I have saved every single one since I first subscribed."
Trouble viewing this issue?
View On-line. »
Tharp Concepts Explained...
-
Trading Psychology
-
System Development
-
Risk and R-Multiples
-
Position Sizing
-
Expectancy
-
Business Planning
Learn the concepts...
Read what Van says about the mission of his training institute.
The Position Sizing Game Version 4.0
Have you figured out yet how to pick the right stocks? Are you still looking for a high win-rate trading system? When you’re ready to get serious about your trader education, download the Position Sizing Game to learn some true fundamentals of trading success. Learn more.
To Download for Free or Upgrade Click Here

Download the 1st three levels of Version 4.0 for free.
Register now. »
Trouble viewing this issue?
View On-line. »

A Thousand Names for Joy: A Commentary
You can read Super Trader Curtis Wee's full review here.
Dr. Tharp is on Facebook

Follow Van through
Twitter »
Van Tharp Trading Education Products are the best training you can get.

Check out our home study materials, e-learning courses, and best-selling books.
Click here for products and pricing
What kind of Trader Are You? Click below to take the test.
Tharp Trader Test
Back to Top

Introduction to Position Sizing™ Strategies
E-Learning Course
Only $149
Learn More
Buy Now
SQN® and the System Quality Number® are registered trademarks of the Van Tharp Institute
Dr. Tharp on Producing a Rarity with his limited edition Safe Strategies book.
Click to read more.
|