Tharp's Thoughts Weekly Newsletter (View On-Line)
-
Article The Presidential Cycle: Part Two, by D. R. Barton Jr.
-
-
Ken's Class Mini-session One Hour, One 6R Trade, by Ken Long
-
Be sure to get that Van Tharp product you've been wishing for onto your wish list for the coming holidays! It's not often that we have these items on sale!
All VTI Products Are On Sale...

The Presidential Cycle: Useful or “Rubbish”?
Part Two
by D.R. Barton, Jr.
"Facts are stubborn, but statistics are more pliable." —Mark Twain
In my 15 years at DuPont, I had the chance to work with some really world-class statisticians on various production quality issues. Every time I talked with one of them, I was amazed at how this very useful field is mired in terminology and minutiae that causes more practically minded folk to pull our hair out! I found that getting a simple answer from a statistician was a bit like trying to take a sip out of a fire hose.
A short academic experience with formal statistics didn’t help my jaded perception of the field. After I was accepted into graduate business school, I received a letter stating that I needed to take a prerequisite statistics course before starting business school. What? I had earned a B.S. in chemical engineering and was only three courses shy of earning an minor in mathematics. I brought these points up with the dean of the MBA program, but he rigidly stuck to the letter of the law and insisted that I take a pure statistics course.
So, the summer before I started business school, I showed up for a Statistics 505 class and, I kid you not, spent the whole first day on the intersections and unions of sets. I informed the professor that I wouldn’t be returning. I went home, grabbed one of my undergraduate text books, marched into the dean’s office and flipped the book open to one of the chapters on statistical thermodynamics. “If I passed this course, I don’t think I’ll slow down any of our MBA classes with my lack of statistical knowledge”, I opined to the dean. He begrudgingly signed my prerequisite waiver.
So it is with this somewhat skeptical view of the discipline that I felt a statistical “burr under my saddle” this week. In last week's newsletter article, we looked at the stock cycle related to the presidential election cycle. Another article I referenced supposedly debunked the validity of the presidential election cycle on the simple basis that the cycle had only 27 data points, not the 30 required by statistical rule. Therefore the author concluded that the idea of a presidential election cycle is statistical noise or, to use his exact quote, “absolute rubbish”. I have been amazed at how many people read this so called “in-depth analysis”; Forbes.com has even published it in their personal finance section!
For some reason, that ill-conceived article rattled around in my head all week. And like a small pebble in my shoe, it was irritating just enough to make me stop what I was doing and take care of it. And you, beleaguered reader, are the beneficiary of my anguish because in my research, I found a cool visual way to look at statistical significance and sample size that I think you might find useful as well. Let’s dig in.
Presidential Election / Stock Market Cycle: How Many data points do you need?
For a quick refresh about the presidential election / stock market cycle you might want to read last week’s article.
The real question before us is whether the presidential election cycle has enough data points to be statistically valid. Saying that a group of 27 data point is no good but 30 would work really well just doesn’t cut it. We know from last week’s article that one peer reviewed article ran the statistical validity numbers and found that even the smaller sample of post-WWII results were valid. And for those of you who really want to “geek out” on presidential election stock cycles, here’s another peer reviewed article that validates the phenomenon with some rather unique tools. You can check out the paper by Nickles and Granados at Pepperdine University’s Graziadio School of Business journal by clicking this link: http://gbr.pepperdine.edu/2012/10/presidential-cycle-and-stock-market/
Interestingly, the more I’ve dug into this seasonal cycle the more support I have found for it! But I do want to show you a cool visual way to see if a sample size is sufficient. Jed Campbell’s excellent website suggested a visual observation and provided the spreadsheet to draw the graphs below.
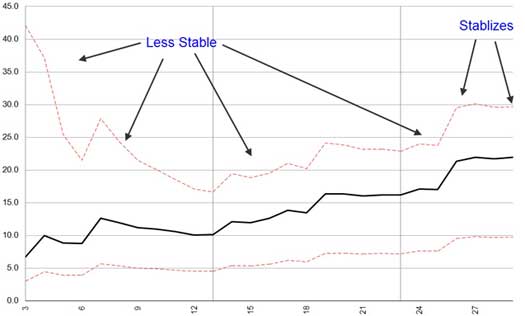
In short, a “sufficient” sample size is one where the standard deviation and the confidence intervals around the standard deviation stop jumping around and settle down to a smooth reading. The sample progresses towards that point of validity as its number of data points increases.
The chart below looks at the Yale Hirsh data for market returns during the best year of the presidential election cycle, year 3 or the pre-election year. The chart shows all 44 presidential cycles dating back to 1833. As you can imagine, the variability among only a few data points will be pretty large, and the difference between the upper limit (hashed red line) and the lower limit (lower hashed red line) is wide—especially wide for the first 6 samples. As the sample size become larger (moving toward “sufficient”), the upper and lower confidence limits converge and stabilize and the standard deviation (middle black line) smoothes out as well:
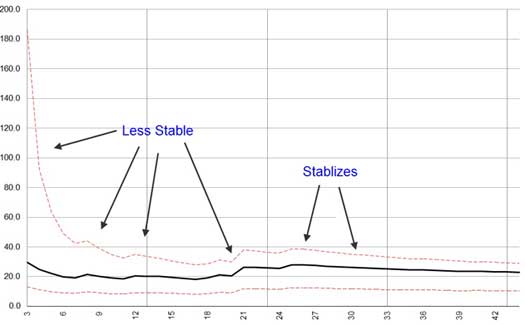
After how many elections (x axis) do your eyes see the data even out and reaching some stability? Probably somewhere between 25 and 28 data points. Statisticians have seen this same phenomenon across a wide variety of data sets which has led to the 30 data points rule of thumb.
For the sake of completeness, let’s look at the standard deviation and upper/lower confidence limits charts for the other years in the election cycle. Here is the worst performing year in the presidential cycle that Hirsch found, year 1 or the post-election year:
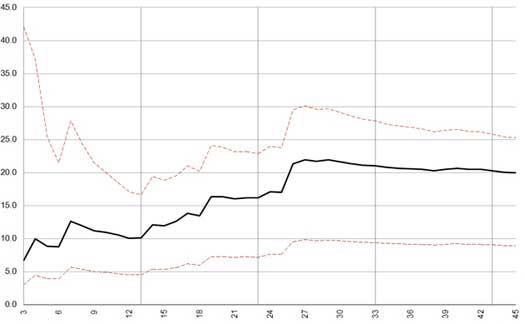
You can see that this data set remains unstable for a longer period. This culminates in the big jump in standard deviation at data point 26 in 1933— when the market had a whopping 66.7% up year during FDR’s first year in office. Compare this to the next chart, the second year of the cycle dubbed the mid-term year:
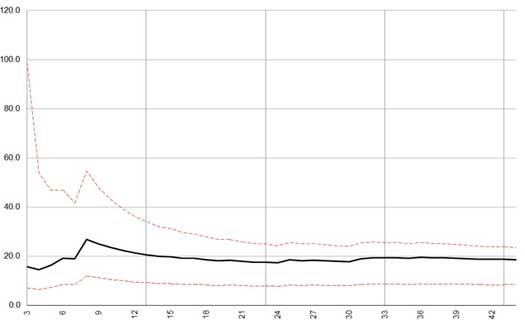
Here, we notice that the data set is much smoother with fewer bumps and a quicker confluence of the confidence limits. Lastly we have year 4 or election year for the cycle:
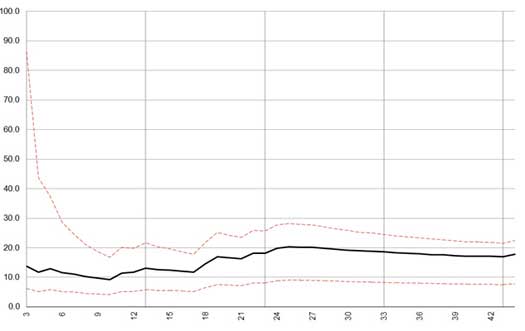
Nothing too exciting here either as we see the data stabilize less quickly than the year two data, but more quickly than year one data and about on par with year three. This leaves us with only one more graph to look at.
The presidential cycle debunker seemed to make a reasonably valid claim that Hirsch’s pre-1900 stock data was suspect, since there were no standard indexes to draw from. So what if we did look at only the post-1900 data? Does the data look like it stabilizes and passes the visual test? To check this, let’s use the toughest test, the least stable data from year one:
It certainly looks like the visual method confirms what the peer reviewed papers found—that there is in fact statistically validity to a slightly smaller data set than the rule of thumb 30.
A Word of Caution
Remember that even validated seasonal patterns do not give us certainty. Rather, these seasonal patterns help push our expectation in a particular direction and can therefore give us an edge.
I hope that this unique visual way of looking at sample size implications has been as enlightening for you as it was for me!
With the U.S. celebrating Thanksgiving on Thursday, my hope and prayer is that your thoughts of gratitude are overflowing at least as much as your gravy bowl. A very Happy Thanksgiving to all of you!
If you’ve found this article useful or thought provoking (or both), I’d love to hear your thoughts and feedback – just send an email to drbarton “at” vantharp.com. Until next week…
Great Trading,
D. R.
About the Author: A passion for the systematic approach to the markets and lifelong love of teaching and learning have propelled D.R. Barton, Jr. to the top of the investment and trading arena. He is a regularly featured guest on both Report on Business TV, and WTOP News Radio in Washington, D.C., and has been a guest on Bloomberg Radio. His articles have appeared on SmartMoney.com and Financial Advisor magazine. You may contact D.R. at "drbarton" at "vantharp.com".
Disclaimer
Trading Education
Workshops
Learn How You Can Get A Full Refund on Van's January 12th Workshop.
January 12 |
New Addition! Tharp Think; One-Day Workshop.
Click here to see the refund promotion.
|
| January 18-20 |
Peak Performance 101
Required for All Super Trader Candidates |
| February 8-10 |
How to Develop A Winning Trading System Workshop
This will be the only US date for this workshop in 2013 |
| February 12-14 |
Blueprint for Trading Success
This will be the only US date for this workshop in 2013 |
|
Van Returns to Australia!
|
March 1-3 |
Peak Performance 101 - Australia |
March 5-8 |
Peak Performance 202- Australia
|
March 15-17 |
Peak Performance 203 - Australia
"The Happiness" Workshop
|
To see the schedule, including dates, prices, combo discounts and location, click here.
Ken's Class
One Hour, One 6R Trade!
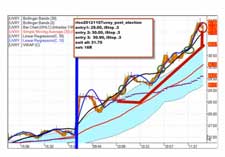 On November 14, Ken recorded a “Trade Of The Day” YouTube lesson. He explains the scaling entries and single exit from UVXY. On November 14, Ken recorded a “Trade Of The Day” YouTube lesson. He explains the scaling entries and single exit from UVXY.
Preparation and execution allowed Ken’s trade to capture 6R in the space of about an hour.
http://youtu.be/tmU0iYc89bw
Happy Thanksgiving!
Thank you for being an important part of what we do. All of us at VTI are grateful to you for subscribing to this newsletter and for reading these articles. We want to transform the world one trader at a time and we could not do it without our subscribers. —From Van and Kala Tharp and the VTI Staff, which includes:
RJ Hixson (Research and Development), Cathy Hasty (Operations and Marketing), Revathi Ramaswami (Accounts and Finance), Frank Eaves (Research Assistant), Micah Spinelli (Customer Relations) and our newest member, Matt Fair (Research Assistant).
Ask Van...
Everything we do here at the Van Tharp Institute is focused on helping you improve as a trader and investor. Consequently, we love to get your feedback, both positive and negative!
Click here to take our quick, 6-question survey.
Also, send comments or ask Van a question by clicking here.
Back to Top
Contact Us
Email us at [email protected]
The Van Tharp Institute does not support spamming in any way, shape or form. This is a subscription based newsletter.
To change your e-mail Address, e-mail us at [email protected].
To stop your subscription, click on the "unsubscribe" link at the bottom left-hand corner of this email.
How are we doing? Give us your feedback! Click here to take our quick survey.
800-385-4486 * 919-466-0043 * Fax 919-466-0408
SQN® and the System Quality Number® are registered trademarks of the Van Tharp Institute
Back to Top |
Nov 20, 2012 - Issue 604

Happy Thanksgiving!
The Van Tharp Institute will be closed Thursday and Friday, November 22-23 for the holiday.
Develop an attitude of gratitude, and give thanks for everything that happens to you, knowing that every step forward is a step toward achieving something bigger and better than your current situation.--Brian Tracy
Thankfulness is the beginning of gratitude. Gratitude is the completion of thankfulness. Thankfulness may consist merely of words. Gratitude is shown in acts. --Henri Frederic Amiel
Gratitude unlocks the fullness of life. It turns what we have into enough, and more. It turns denial into acceptance, chaos to order, confusion to clarity. It can turn a meal into a feast, a house into a home, a stranger into a friend.--Melody Beattie
How are we doing?
Give us your feedback!
Click here to take our quick survey.
From our reader survey...
"I think the newsletter is extremely generous and it is a resource I utilize constantly. I have saved every single one since I first subscribed."
Trouble viewing this issue?
View On-line. »
Mission Statement
The Position Sizing Game Version 4.0

Download the 1st three levels of Version 4.0 for free.
Register now. »
Trouble viewing this issue?
View On-line. »
Dr. Tharp is on Facebook

Follow Van through
Twitter »
Van Tharp Trading Education Products are the best training you can get.

Check out our home study materials, e-learning courses, and best-selling books.
Click here for products and pricing
What kind of Trader Are You? Click below to take the test.
Tharp Trader Test
Back to Top
SQN® and the System Quality Number® are registered trademarks of the Van Tharp Institute
|