Tharp's Thoughts Weekly Newsletter (View On-Line)
-
Article May 2012 Market Condition: Bear Normal by Van K. Tharp, Ph.D.
-
-
TradingTip May 2012 SQN® Report by Van K. Tharp, Ph.D.
New! Three-Day Forex Workshop
$700 Early Enrollment Discounts Expire Today, June 6th
Click Here to Learn More About The Workshop.
 Market Update for the Period Ending May 31, 2012 Market Update for the Period Ending May 31, 2012
Market Condition: Bear Normal
by Van K. Tharp, Ph.D.
I always say that people do not trade the markets; they trade their beliefs about the markets. Consequently, I'd like to point out that these updates reflect my beliefs. I find the market update information useful for my trading, so I do the work each month and am happy to share that information with my readers.
If, however, your beliefs are not similar to mine, then this information may not be useful to you. If you are inclined to perform some sort of intellectual exercise to prove one of my beliefs wrong, simply remember that everyone can usually find lots of evidence to support their beliefs and refute others. Know that I acknowledge that these are my beliefs and that your beliefs may be different.
These updates are in the first issue of Tharp's Thoughts each month. This allows us to get the closing month's data. These updates cover 1) the market type (first mentioned in the April 30, 2008 edition of Tharp's Thoughts and readable on our web site), 2) the five-week status on each of the major U.S. stock market indices, 3) our four star inflation-deflation model plus John Williams' statistics, and 4) the movement of the dollar. I now report on the strongest and weakest areas of the overall market in a separate SQN® Report. I may come out with that report twice a month if there are significant market charges.—Van K. Tharp
Part I: Commentary—The Big Picture
Remember that we are in a long-term secular bear market that is likely to last for about 20 years. This one started in 2000, so we have about another eight years to go. If you had invested your money in the stock market back in 2000 and held it there until now, you’d be quite unhappy with the result—especially after you included the effects of inflation and the decline in the value of the U.S. dollar relative to other currencies.
Prices in a secular bear can go sideways with a lot of volatility for a long time—like they have for the last ten years. Secular bear markets don’t say much about where prices will go; it’s the price earnings ratios that decline. P/E ratios will go down probably into the single digits for blue chip stocks by the end of the bear market. We’re still a long way from that.
Also, secular bear markets don’t necessarily correspond with weak big-picture fundamentals. The economy can seem fine or even grow in a secular bear market. The very weak fundamentals we have right now, however, do not make things look good for this next phase.
Last month, I mentioned that the market usually goes up between November and May because of pension money flowing into the system. June through October, on the other hand, is generally a much weaker part of the year for the market. This year, that cycle may have started early.
Part II: The Current Stock Market Type Is Bear Normal
Each month, I look at the market SQN® score for the daily percent changes in the S&P 500 Index over 200, 100, 50 and 25 days. For our purposes, the S&P 500 Index defines the market. The 200-day market SQN is neutral. The 25- and 100-day market SQN scores are strong bear, while the 50-day is bearish.
We use the 100-day market SQN to classify the market type. On May 31st, the 100-day market SQN ended in the neutral range, at 0.01—just 2 hundredths of a point away from bear. On June 4th, the market SQN changed to bear.
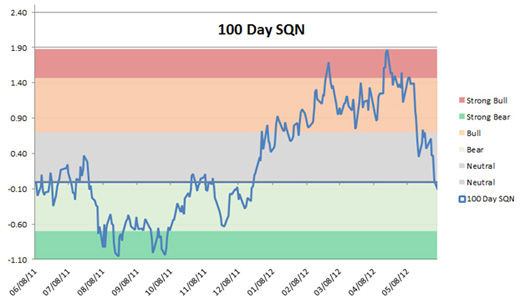
Here’s the weekly candlestick chart of the S&P 500 for the last year, which shows how the SQN scores relate to the actual prices.
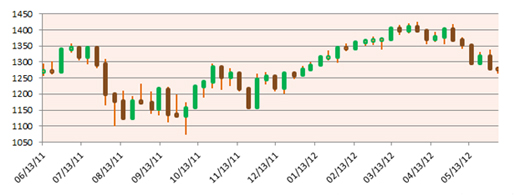
Notice the nice uptrend since last December and how the market type reflected it. The market went flat in April and then went into a downward spiral in May, until it became classified as a bear market in the last few days.
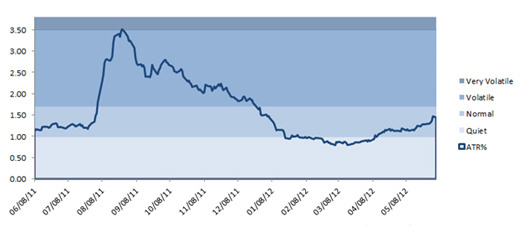
The next graph shows that market volatility is still in the normal range, but notice how it picked up in May. Bear markets are usually very volatile or at least volatile.
The next table shows the activity of the three major U.S. indices.
| Weekly Changes for the Three Major Stock Indices |
| |
Dow 30 |
|
S&P 500 |
|
NASDAQ 100 |
|
| Date |
Close |
% Change |
Close |
%Change |
Close |
% Change |
| Close 04 |
10,783.01 |
|
1,211.12 |
|
1,621.12 |
|
| Close 05 |
10,717.50 |
-0.60% |
1,248.29 |
3.07% |
1,645.20 |
1.50% |
| Close 06 |
12,463.15 |
16.29% |
1,418.30 |
13.62% |
1,756.90 |
6.79% |
| Close 07 |
13,264.82 |
6.43% |
1,468.36 |
3.53% |
2,084.93 |
18.67% |
| Close 08 |
8776.39 |
-33.84% |
903.25 |
-38.49% |
1,211.65 |
-41.89% |
| Close 09 |
10428.05 |
18.82% |
1,115.1 |
23.45% |
1,860.31 |
53.54% |
| Close 10 |
11,577.51 |
11.02% |
1,257.64 |
12.78% |
2,217.86 |
19.22% |
| Close 11 |
12,217.56 |
5.53% |
1,256.60 |
-0.08% |
2,277.83 |
2.70% |
| 04-May-12 |
13,038.27 |
6.72% |
1,391.57 |
10.74% |
2,637.92 |
15.81% |
| 11-May-12 |
12,820.60 |
-1.67% |
1,357.99 |
-2.41% |
2,615.98 |
-0.83% |
| 18-May-12 |
12,369.38 |
-3.52% |
1,304.86 |
-3.91% |
2,478.53 |
-5.25% |
| 25-May-12 |
12,454.83 |
0.69% |
1,320.68 |
1.21% |
2,527.05 |
1.96% |
| 01-Jun-12 |
12,118.57 |
-2.70% |
1,310.33 |
-0.78% |
2,458.83 |
-2.70% |
| Year to Date |
12,118.57 |
-0.81% |
1,310.33 |
4.28% |
2,458.83 |
7.95% |
In April, the market looked great, with all indices up. In just one month, the Dow 30 has turned negative on the calendar year, the S&P 500 has given up 60% of its gains and the NASDAQ 100 has given up about 50% of its gains.
Part III: Our Four Star Inflation-Deflation Model
In the simplest terms, inflation means that stuff gets more expensive, and deflation means that stuff gets cheaper. There’s a correlation between the inflation rate and market levels, so the inflation rate can help traders understand big-picture processes.
Right now, we seem to have the start of a deflationary trend that gained strength in the last month. In a deflationary market, cash is king.
Here is my four-star inflation-deflation model for the last few years.
| Date |
CRB/CCI |
XLB |
Gold |
XLF |
Total Score |
| Dec 05 |
347.89 |
30.28 |
513.00 |
31.67 |
|
| Dec 06 |
394.89 |
34.84 |
635.50 |
36.74 |
|
| Dec 07 |
476.08 |
41.70 |
833.30 |
28.90 |
|
| Dec 08 |
352.06 |
22.74 |
865.00 |
12.52 |
|
| Dec 09 |
484.42 |
32.99 |
1,104.00 |
14.10 |
|
| Dec 10 |
629.53 |
38.47 |
1,410.25 |
16.00 |
|
| Dec 11 |
564.37 |
33.50 |
1,574.59 |
13.00 |
|
| Aug 11 |
661.93 |
35.34 |
1,813.50 |
13.38 |
+0.5 |
| Sep 11 |
571.38 |
29.36 |
1,620.00 |
11.81 |
-0.5 |
| Oct 11 |
604.28 |
34.45 |
1,724.20 |
13.50 |
-0.5 |
| Nov 11 |
584.22 |
34.53 |
1,746.00 |
12.81 |
+0.5 |
| Dec 11 |
564.37 |
33.50 |
1,574.59 |
13.00 |
+0.5 |
| Jan 12 |
589.00 |
37.18 |
1,744.00 |
14.06 |
0 |
| Feb 12 |
600.32 |
36.97 |
1,724.60 |
14.76 |
-0.5 |
| Mar 12 |
572.94 |
36.97 |
1,662.57 |
15.80 |
+1.0 |
| Apr 12 |
558.55 |
36.67 |
1,651.25 |
15.43 |
-2.5 |
| May 12 |
508.76 |
33.82 |
1,606.00 |
14.00 |
-3.5 |
I use the most recent two-month and six-month periods to calculate the current month's score, given in the table below.
| March 2012 |
CRB
2 Mo |
CRB
6 Mo |
XLB
2 Mo |
XLB
6 Mo |
Gold
2 Mo |
Gold
6 Mo |
XLF
2 Mo |
XLF
6 Mo |
Total Score |
| Current Level |
Lower |
Lower |
Lower |
Lower |
Lower |
Lower |
Lower |
Higher |
|
| Score |
|
-1 |
|
-1 |
|
-1 |
|
-1/2 |
-3.5 |
We seem to have a deflationary scenario developing, and it is getting stronger, moving from -2.5 to -3.5. When you look at the SQN® report, you’ll see that across the board, commodities—including gold—are way down, which is another major sign of deflation.
I recently saw an article that said the CME lowered the margin on gold by 10% and that the Fed was prepared to back the U.S. exchanges in case they have a run on gold (i.e., many people concurrently want delivery of their gold futures). The article suggested that the central banks may have done as much as they can do to keep the price of gold down. I, however, have seen no sign of the public masses returning to buy rare coins, because the premiums on rare gold coins did not increase much at all during the huge gold price runup to $1,800.
That runup stoked fears of inflation, and Shadowstats.com still shows that the real inflation rate is about 10%. Based partly on those statistics, Shadowstats also shows the GDP as having had negative growth since 2000 (meaning recession) in all but one quarter of 2003.
Part IV: Tracking the Dollar
While continued low interest rates have been good for the stock market, they have been not so good for the U.S. dollar. Last month, however, I said the dollar was at the bottom of a trading range and look what happened in May. It had a huge and very steep run from below 79 all the way through 83. Anyway, whoever caught that move has done very well indeed.
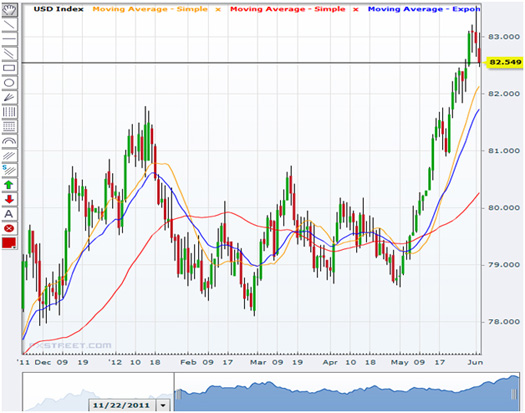
When you consider the recent rise in the dollar’s value, the slight fall in gold has not been too disappointing.
General Comments
If you play the equities market, you should now be considering systems that work in bear markets—which tend to be volatile. If you are fully invested in equities for the long term, consider reducing your risk. Perhaps the stock market could see the “end of the world” by the end of 2012.
If the market moves back into bull territory this month, I’ll issue a special report. Also, watch the VXX. If it continues to go up, expect a much stronger bear market.
These monthly market updates are not intended for predictive purposes; they’re intended to help traders decide which of their trading systems should work best in the current market conditions. In bear markets—which are almost always volatile by nature—shorter-term strategies, and those that allow going short, tend to work better than long-only or intermediate/longer-term systems.
Which of your trading systems fit this current market type? Of course, this question implies that you actually have multiple trading systems and that you know how they perform under various market conditions. If you haven't heard of this concept or the other concepts mentioned above, read my book Super Trader—which covers these areas and many others—so that you can make money in any kind of market condition.
Crisis always implies opportunity. Those with good trading skills can make money in this market—a lot of money. There were many good opportunities in 2011 and, so far, many more in 2012. Did you make money? If not, do you understand why not? The refinement of good trading skills doesn't just happen by opening an account and adding money. You probably spent years learning how to perform your current job at a high skill level. Do you expect to perform at the same high level in your trading without similar preparation? Financial market trading is an arena filled with world-class competition. Trading requires massive self-work to produce consistent, large profits under multiple market conditions. Prepare yourself to succeed with a deep desire, strong commitment and the right training.
About the Author: Trading coach, and author, Dr. Van K. Tharp is widely recognized for his best-selling books and his outstanding Peak Performance Home Study program—a highly regarded classic that is suitable for all levels of traders and investors. You can learn more about Van Tharp at www.vantharp.com.
Trading Education
Workshops
Sign up today to qualify for the Forex Workshop early enrollment discount!
Learn what it takes to trade Forex and go home with proven trading systems—you'll even get some hands-on trading experience during the workshop using simulators!
June
14-16 |
$3,295
$3,995
|
Forex Trading
New! Three-Day Workshop |
Cary, NC |
June
23-24 |
$195 |
Oneness Awakening Workshop
with Van Tharp
Become more aware,
positive, calm, centered, and successful. |
Cary, NC |
July
21-22 |
$2,295
$2,995
|
Core Trading Systems: Market Outperformance and Absolute Returns
Longer-term systems that don't tie you down. |
Cary, NC |
August
3-5 |
$3,295
$3,995
|
Frog Trading System Boot Camp
Presented by Ken Long |
Cary, NC |
August
24-30 |
$5,090
(combo) |
Peak 101 and Peak 203 (AKA, The Happiness Workshop) |
Cary, NC |
| Sept 21-28 |
Varies |
Mechanical Systems for Day and Swing, and Discretionary Live Trading
Presented by Ken Long |
Cary, NC |
| October 19-21 |
$2,295
$2,995
|
Peak Performance 101
Van Tharp's Signature Workshop |
Cary, NC |
| October 23-26 |
$3,295
$3,995
|
Peak Performance 202
with Van Tharp and Dr. Libby Adams |
Cary, NC |
To see our full workshop schedule, including dates, prices and location, click here.
Trading Tip
May 2012 SQN® Report
by Van K. Tharp, Ph.D.
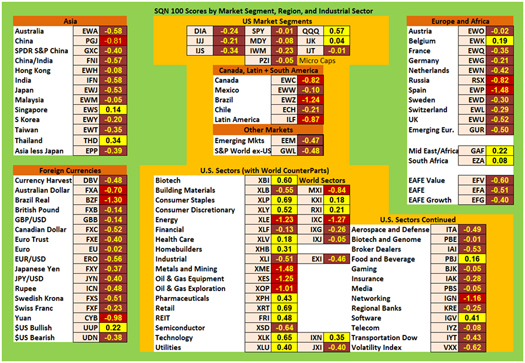
There are numerous ETFs that now track everything from countries, commodities, currencies and stock market indices to individual market sectors. ETFs provide a wonderfully easy way to discover what’s happening in the world markets. Consequently, I now use the System Quality Number® (SQN®) score for 100 days to measure the relative performance of numerous markets in a world model.
The SQN 100 score calculates the SQN based on the daily percent change for a 100-day period. Typically, an SQN score over 1.45 is strongly bullish; a score below -0.7 is very weak. We use the following color codes to help communicate the strength or weakness of the ETFs.
- Green: Very strong ETFs with positive SQN scores (0.75 to 1.5).
- Yellow: ETFs with slightly positive SQN scores (0 to 0.75).
- Brown: ETFs with slightly negative SQN scores (0 to -0.7).
- Red: Very weak ETFs with negative SQN scores (< -0.7).
The world market model spreadsheet report below contains most currently available ETFs, including inverse funds, but excluding leveraged funds. In short, it covers the geographic world, the major asset classes, the equity market segments, the industrial sectors and the major currencies.
World Market Summary
It’s been a while since I’ve seen an SQN world market summary that looks as bad as the one below. There is not a single green ranking in any equities market, segment, sector, or currency. There are only a few yellows and most of the model is brown and red. Money is fleeing the market again.
So let’s talk about just the few yellow areas. In the U.S., there are two yellow areas: large caps and the mid-cap growth sector. These are yellow now because they were so strong two months ago, which is still within the last 100 days.
Five other countries/areas in the world are yellow—Singapore, Thailand, Belgium, South Africa and Mideast/Africa. But again, these areas all have numbers of 0.22 or below and are only yellow because they were so strong two months ago.
A number of U.S. sectors are still yellow, and I’ll confine my discussion to those with scores about 0.5. There are four areas with this qualification: biotech, consumer staples, retail and technology. Again, all of these were very strong two months ago, so they’re simply less weak relative to the other areas.
The U.S. dollar is the only currency in yellow, but not because it was strong several months ago and is now weaker. It had a very sharp move up in May, and if you captured most of that trend, it probably made your year look very good so far.
View Larger Image
What’s happening in the world model shows an aspect of the secular bear market. I’ve been talking for some time now. Trends in secular don’t last very long, which means that you need to be a trader, not an investor. You need systems that make money over days or a few weeks—not months or years.
Other Asset Classes, Strongest/Weakest ETFs
The next table shows the relative performance of commodities, real estate and interest rates on the left-hand side. So, do these groups look any better? If so, what does that tell us? Once again, even with extremely low interest rates, big money has scurried into interest rate instruments. But, as I’ve said many times, this area is not safe at all; interest rates are historically low, and, generally, interest rate products can only go DOWN IN VALUE when interest rates cannot go much lower. However, most of the interest rate products are now light green. Furthermore, if you look at the top 15 ETFs in green on the right hand side of the table, they tend to be interest rate products of some sort.
Real estate, including the U.S., China, and the rest of the world, are all yellow. Commodities are all red and brown, with the exception of global water. The energy sector—oil, natural gas and coal—are all red. And for the first time in recent memory, gold has moved into brown territory.
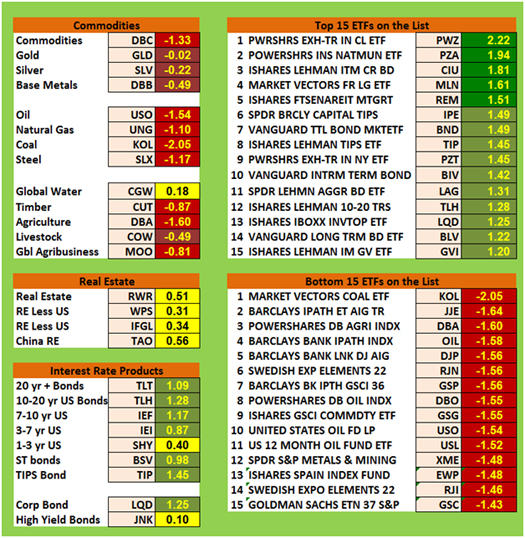
The weakest ETFs in the database are on the lower right, and they generally tend to be energy or agriculture-related. Spain comes up as one of the worst ETFs, as does metals and mining.
What's Going On?
As I said last month, the big picture is not that good. Fundamentally, the U.S. is in the worst shape it has been in a long, long time. Our debt looks asymptotic and the dollar (despite its recent rise to the upside) could soon be dismissed as the world’s reserve currency. Countries such as Italy and Spain could leave the European Union, or, even worse, Germany could stop supporting the Euro. China’s economy has weakened and is therefore no longer buying up the world’s supply of commodities.
Crises always offer opportunities, but to capture those opportunities you MUST know what you are doing. If you want to trade these markets, you need to approach them as a trader, not a long-term investor. We’d like to help you learn how to trade professionally. Trying to navigate these markets without an education is hazardous to your wealth.
All the beliefs given in this update are my own, and though I find them useful, you may not. You can only trade your beliefs about the markets.
Until next month, this is Van Tharp.

Peak Performance Home Study Program for Traders and Investors
Are you interested in learning how to make extra profits from the market over the next year or two?
With this home study course, you’re going to learn to do exactly that with your trading—regardless of any limits you may have put on your time—by discovering the simple "edge" you need for super success in the markets today.
Once you master key trading principles often overlooked by even the most experienced investors and traders, you’ll finally understand and possess the same money-making and cash-flow secrets that have catapulted certain astute traders to superstar wealth and success status. You’ll understand why they continue to make money while everyone else is losing their shirts.
Learn More
Buy Now
"I would recommend the new Peak Performance Course to anyone who wants to excel in their trading. In fact, I would recommend that no one actively trade until they have gone through this material several times and understand it completely. The new version is excellent, and I found the new chapters on personal responsibility and changing your beliefs to be the most valuable. This course forces you to do the self-work that is critical to successful trading and improving all aspects of your life!"—a happy customer
Ask Van...
Everything we do here at the Van Tharp Institute is focused on helping you improve as a trader and investor. Consequently, we love to get your feedback, both positive and negative!
Click here to take our quick, 6-question survey.
Also, send comments or ask Van a question by using the form below.
Click Here for Feedback Form »
Back to Top
Contact Us
Email us at [email protected]
The Van Tharp Institute does not support spamming in any way, shape or form. This is a subscription based newsletter.
To change your e-mail Address, click here
To stop your subscription, click on the "unsubscribe" link at the bottom left-hand corner of this email.
How are we doing? Give us your feedback! Click here to take our quick survey.
800-385-4486 * 919-466-0043 * Fax 919-466-0408
SQN® and the System Quality Number® are registered trademarks of the Van Tharp Institute
Back to Top |
|
June 6, 2012 - Issue 580


A Must Read for All Traders
Super Trader
How are we doing?
Give us your feedback!
Click here to take our quick survey.
From our reader survey...
"I think the newsletter is extremely generous and it is a resource I utilize constantly. I have saved every single one since I first subscribed."
Trouble viewing this issue?
View On-line. »
Tharp Concepts Explained...
-
Trading Psychology
-
System Development
-
Risk and R-Multiples
-
Position Sizing
-
Expectancy
-
Business Planning
Learn the concepts...
Read what Van says about the mission of his training institute.
The Position Sizing Game Version 4.0
Picking the right stocks has nothing to do with trading success and neither do amazing trading systems with high percentage wins. The Position Sizing Game teaches you the key elements of trading success. Learn more.
To Download for Free or Upgrade Click Here

Download the 1st three levels of Version 4.0 for free.
Register now. »
Trouble viewing this issue?
View On-line. »

A Thousand Names for Joy: A Commentary
You can read Super Trader Curtis Wee's full review here.
Dr. Tharp is on Facebook

Follow Van through
Twitter »
Van Tharp Trading Education Products are the best training you can get.

Check out our home study materials, e-learning courses, and best-selling books.
Click here for products and pricing
What kind of Trader Are You? Click below to take the test.
Tharp Trader Test
Back to Top

Introduction to Position Sizing™ Strategies
E-Learning Course
Only $149
Learn More
Buy Now
SQN® and the System Quality Number® are registered trademarks of the Van Tharp Institute |